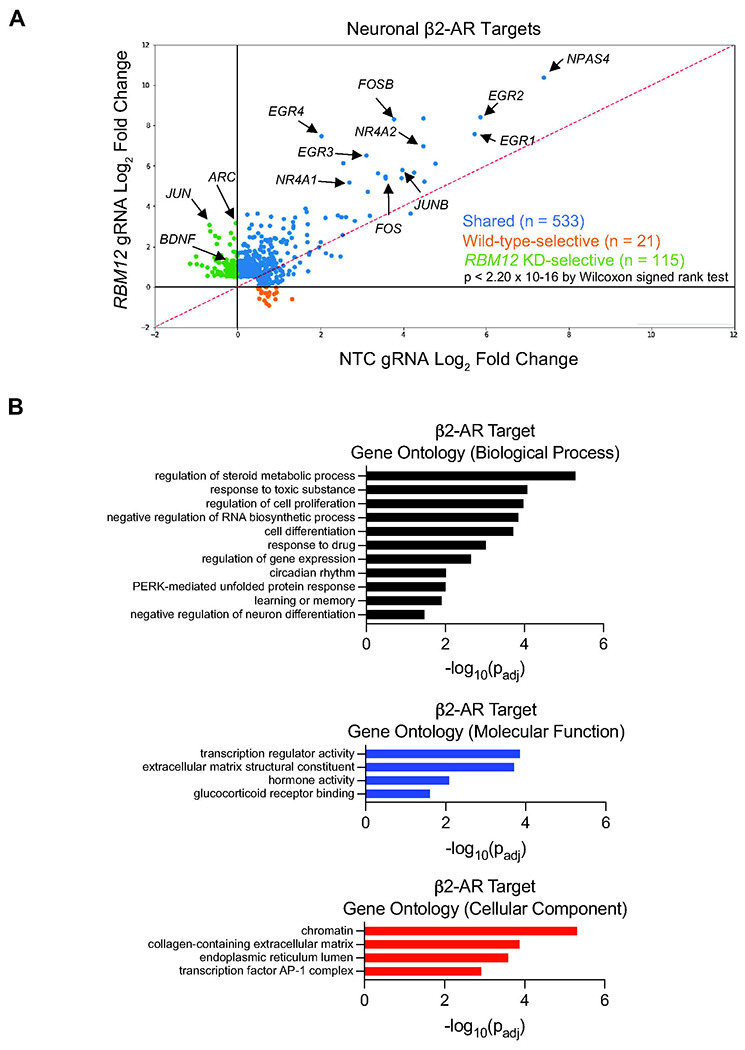
Figure 6. RBM12 loss impacts the β2-AR neuronal transcriptional responses.

(A) Scatter plot showing gene fold induction (log2 Iso/No Drug) of neuronal β2-AR targets (n = 669) identified by RNA-seq analysis (n = 3 per cell line per drug condition). Blue dots represent genes that were induced by a 1-hour treatment with 1 μM Iso in both wild-type (NTC gRNA) and RBM12 KD (RBM12 gRNA) neurons. Orange dots represent genes that were induced only in wild-type and unchanged or downregulated in RBM12 KD neurons. Green dots represent genes that were induced only in RBM12 KD neurons and unchanged or downregulated in wild-type. Indicated by arrows are a subset of genes with established roles in neuronal activity. The underlying information is summarized in Table 1. (B) Gene Ontology categories enriched among the neuronal β2-AR targets from (A). The underlying information is presented in Table 2. See also Figure S6.
