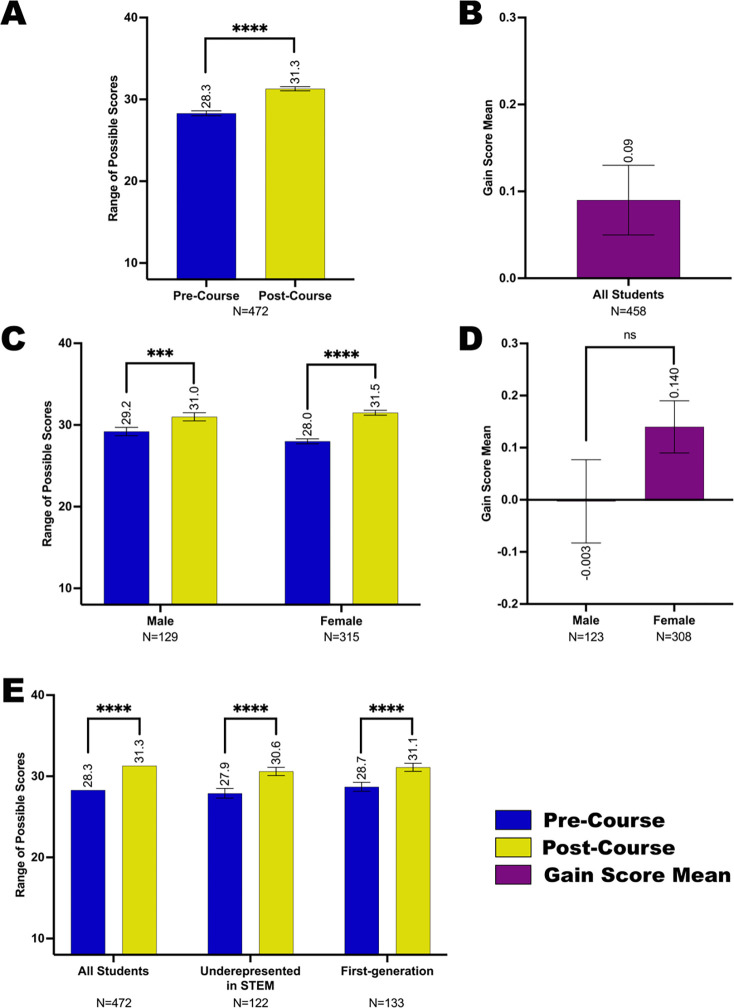
Figure 3. Self-efficacy in scientific research of student subgroups before and after completing the Fly-CURE.
Through pre- and post-course surveys, students reported their efficacy in specific skills associated with scientific research before and after participating in the Fly-CURE. The survey rating scales for eight questions were combined, resulting in a total possible scale score of 40 (y-axis) per student. The mean self-efficacy pre-course (blue) and post-course (yellow) are shown for all participants (A) and in participant subgroups (C,E). (A-B) Self-efficacy scale score mean (A) and gain score mean (B) for all Fly-CURE participants. (C-D) Self-efficacy scale score mean (C) and gain score mean (D) for male and female participants. (E) Comparison of self-efficacy means pre- and post-course in all students, minority students underrepresented in STEM, and first-generation college students. Error bars represent ± standard error of the mean (± SEM); ns, not significant, P > 0.05; ****P ≤ 0.0001.

