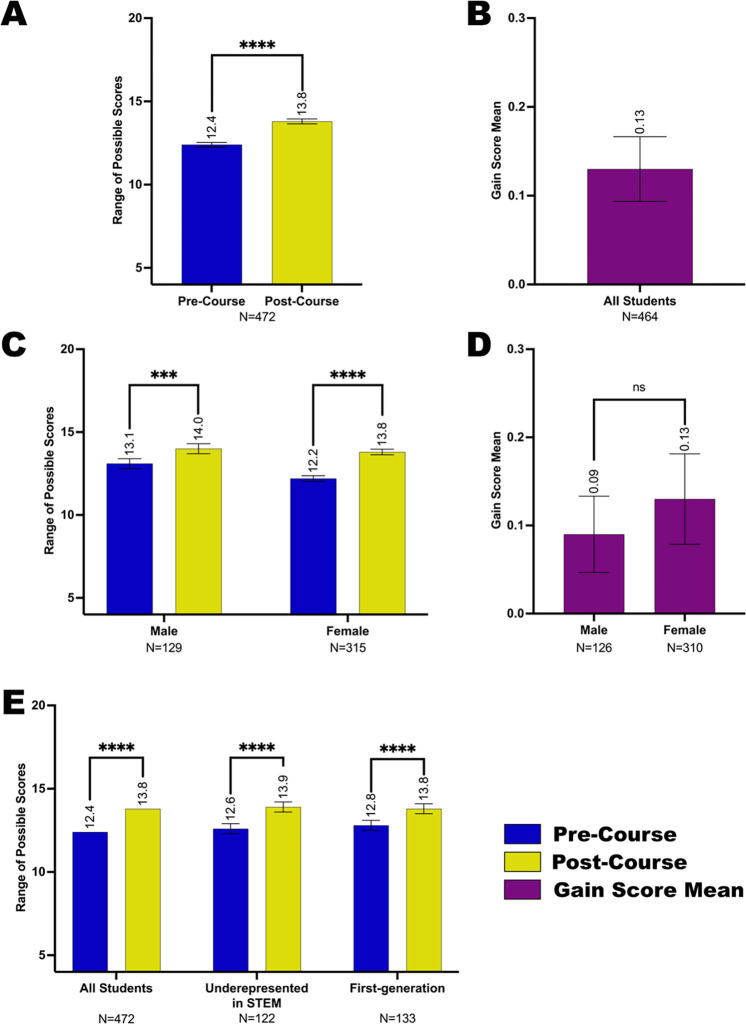
Figure 4. Sense of belonging in the scientific community for student subgroups before and after completing the Fly-CURE.
Through pre- and post-course surveys, students reported their sense of belonging in the scientific community before and after participating in the Fly-CURE. The survey rating scales for four questions were combined, resulting in a total possible scale score of 20 (y-axis) per student. The mean scale score for sense of belonging pre-course (blue) and post-course (yellow) are shown for all participants (A) and in participant subgroups (C,E). (A-B) Sense of belonging scale score mean (A) and gain score mean (B) for all Fly-CURE participants. (C-D) Sense of belonging scale score mean (C) and gain score mean (D) for male and female students. (E) Comparison of reported scale score means for sense of belonging for all participants, minority students underrepresented in STEM, and first-generation college students. Error bars, ±SEM; ns, not significant, P > 0.05; ***P ≤ 0.001; ****P ≤ 0.0001.

