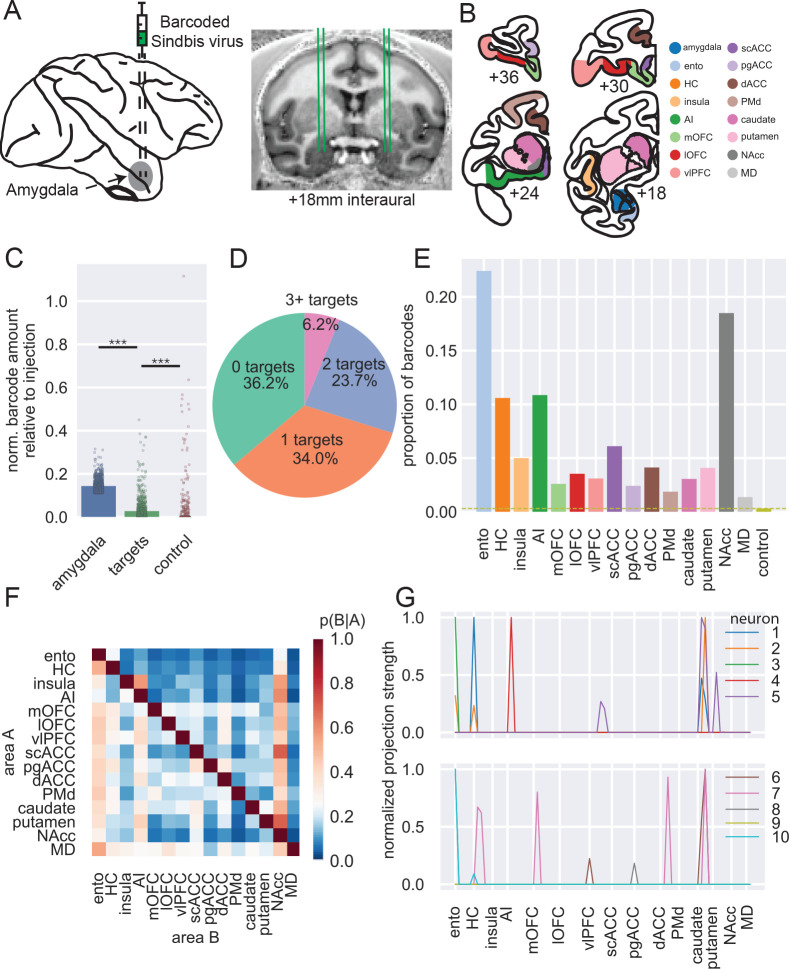
Figure 1: MAPseq of macaque BLA.
A) Schematic of injection approach. B) Example coronal sections showing dissection targets in striatum as well as frontal and temporal lobes. Ento, entorhinal; HC, hippocampus (not shown); AI, anterior insula cortex; mOFC, medial orbitofrontal cortex; lOFC, lateral orbitofrontal cortex; vlPFC, ventrolateral prefrontal cortex; scACC, subcallosal anterior cingulate cortex; pgACC, perigenual ACC; dACC, dorsal ACC; PMd, dorsal premotor cortex; NAcc, nucleus accumbens; MD, mediodorsal thalamus (also not shown). Anterior-posterior levels are in mm relative to the interaural plane. C) Normalized barcode amount relative to peak barcode amount in injection site across other locations in amygdala (blue), all target structures (green; OLS regression vs amygdala: t(2) = 46.43, p < 0.0001), and control areas (red; vs targets: t(2) = 4.77, p < 0.001). D) Proportion of unique barcodes in no targets outside of amygdala (green), one (orange), two (blue), or more than two targets outside of amygdala (red). E) Proportion of barcodes in each of the target and control areas; dashed line indicates the proportion of barcode found in control sites. F) Conditional probability that a barcode in area A is also found in area B. Note that the order of indexing here alters the probability such that P(A|B) can be greater than P(B|A). G) Normalized proportion of barcodes across all the potential target areas and control areas for 10 unique barcodes (colored lines).

