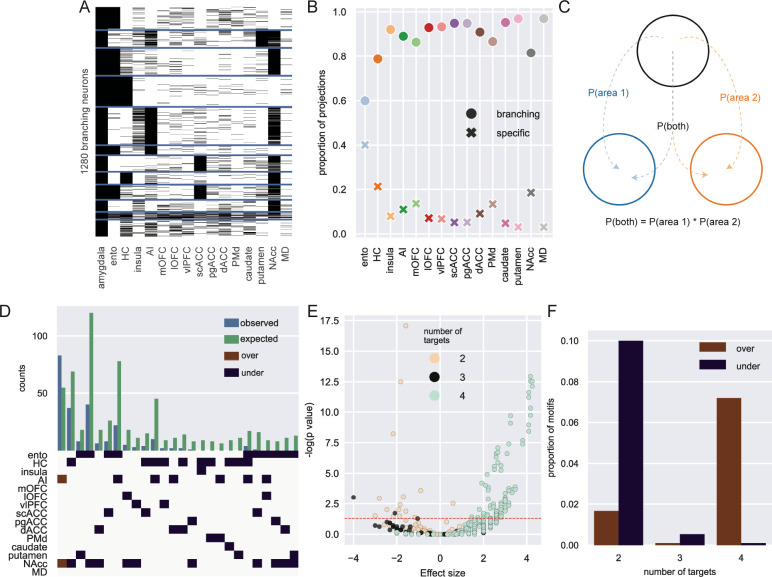
Figure 2: Single neuron analysis of branching projections from BLA.
A) K-means clustering of 1,300 neurons that project to more than one area outside of amygdala (k=12). B) Proportion of projections from BLA to frontal cortex areas, striatum, and mediodorsal thalamus that are from specific (crosses) or branching projections (filled circles). C) Logic of null distribution computation for branching motifs. D) Observed (blue) and expected (green) counts of neurons with projections to multiple areas (top). Specific over (red) or under-represented (blue) branching motifs by area (bottom). E) Volcano plot of probability of all possible branching motifs with 2 (cream), 3 (grey), and 4 (turquoise) target areas. Dashed line marks the level of statistical significance. F) Proportion of significantly over- (red) and under- (blue) represented 2-, 3- and 4- target area branching motifs.

