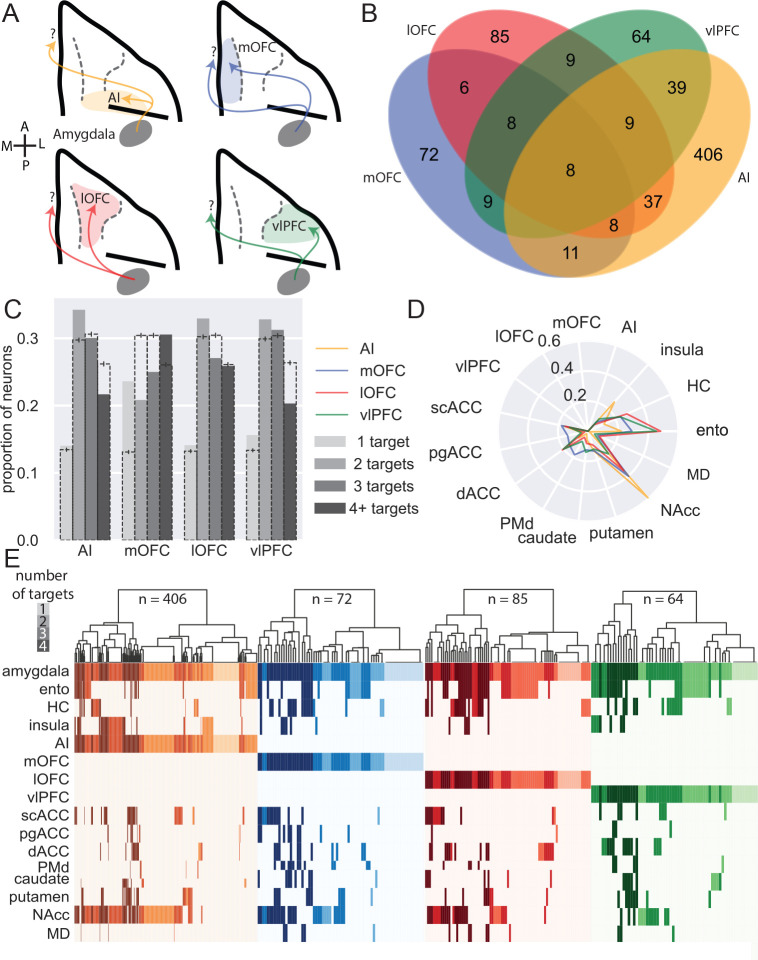
Figure 4: BLA specific projections to ventral frontal cortex.
A) Schematic showing the four populations of ventral frontal cortex-projecting neurons analyzed here: BLA neurons targeting AI (yellow), mOFC (blue), lOFC (red), and vlPFC (green). A and P designate anterior and posterior directions, respectively; M and L refer to medial and lateral. B) Venn diagram illustrating projections to each area that also branch to the other three; AI-projecting neurons were least likely to branch to the other areas (z-test for proportions, z=4.425, p<0.0001), while vlPFC-projecting neurons were most likely to branch within ventral FC (z=2.476, p=0.0133). C) Degrees of branching for each ventral frontal cortex-projecting population; dashed bars indicate the mean of 1000 shuffles of the data, downsampled for equal numbers of neurons from each population; error bars indicate 95% confidence intervals. D) Likelihood of ventral frontal cortex-projecting neurons projecting to non-ventral frontal cortex targets. E) Single-neuron projection patterns; shading indicates number of targets.

