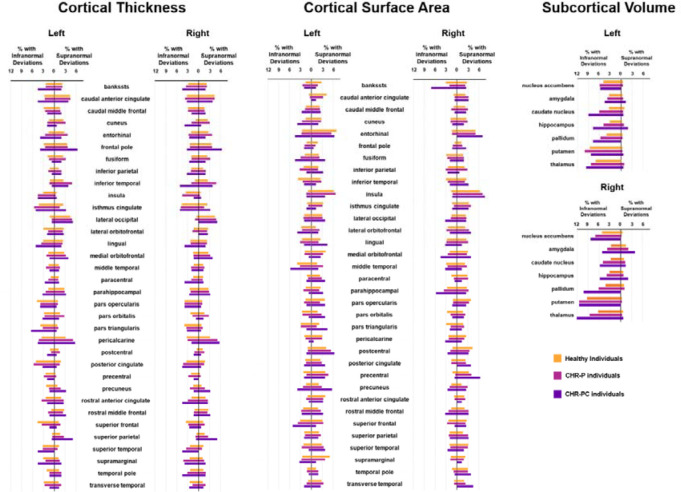
Figure 2. Percentage of subjects with infra- or supranormal regional normative z-scores.
The proportion of healthy individuals, clinical high-risk for psychosis (CHR-P), and cinical high-risk for psychosis converters with infranormal (left) and supranormal deviations (right) are presented for each hemisphere for cortical thickness, cortical surface area, and subcortical volume.

