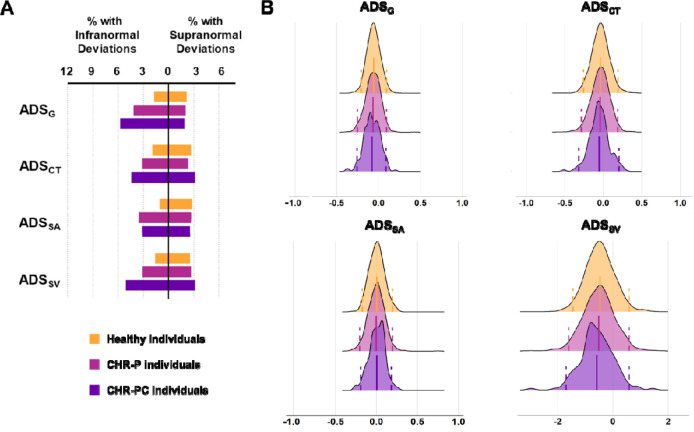
Figure 4. Distributions of average deviation scores and percentage of subjects with infra- or supranormal regional normative z-scores.
A) Percentage of healthy, clinical high-risk for psychosis (CHR-P), and clinical high-risk for psychosis converters (CHR-PC) with supra- or infranormal global average deviation score (ADSG), the average deviation score for cortical thickness (ADSCT), average deviation score for cortical surface area (ADSSA), and average deviation score for subcortical volumes (ADSSV). B) The distributions of the average deviation scores in CHR-P (magenta color), CHR-PC (purple color), and healthy individuals (yellow color) for ADSG, ADSCT, ADSSA, and ADSSV. The dotted lines represent the cutoffs for infranormal and supranormal values at z = |1.96|.

