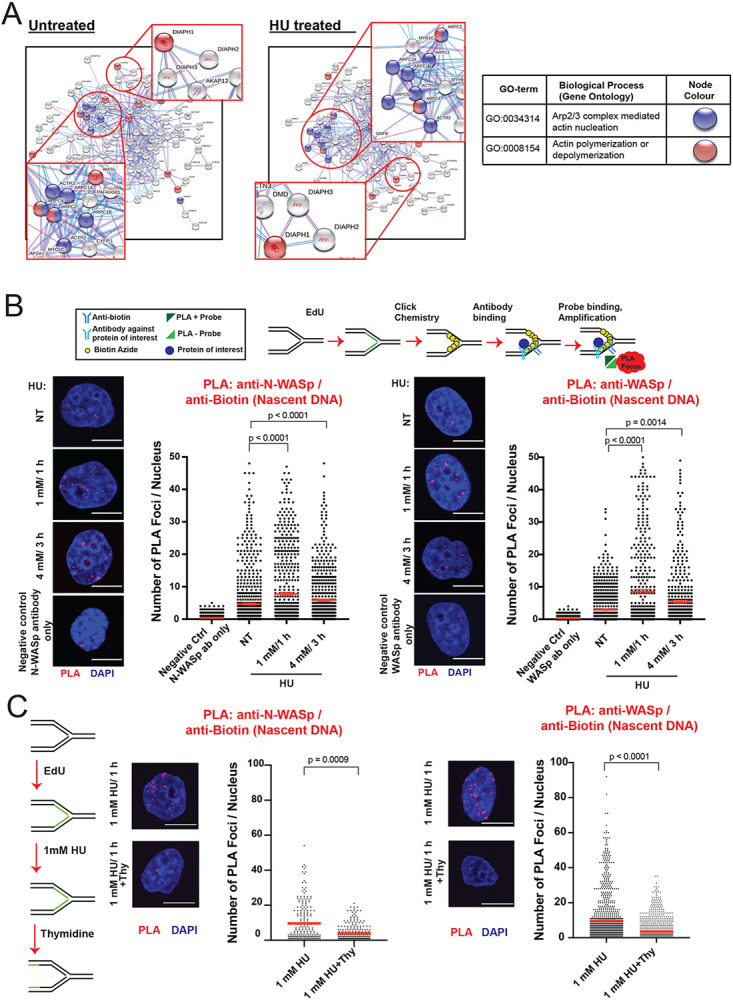
Figure 1. WASp, N-WASp and DIAPH1 associate with replication forks.

A. STRING analysis of iPOND/MS data in untreated and HU treated HeLa S3 cells.
B. Representative images and dot plots of the number of N-WASp/Biotin (Nascent DNA) and WASp/Biotin (Nascent DNA) PLA foci per nucleus in HeLa cells upon HU treatment as indicated (red lines indicate mean values). Dot plots represent data pooled from three independent experiments. Statistical significance was determined using the Mann-Whitney test.
C. Representative images and dot plots of number of N-WASp/Biotin (Nascent DNA) and WASp/Biotin (Nascent DNA) PLA foci per nucleus in HeLa cells treated with 1mM HU for 1h, followed or not by thymidine chase as indicated (red lines indicate mean values). Dot plots represent data pooled from two independent experiments. Statistical significance was determined using the Mann-Whitney test.
