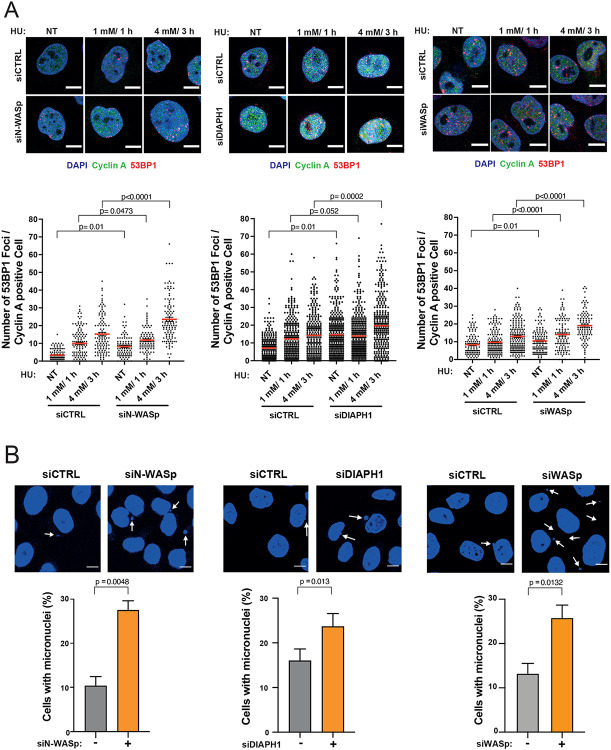
Figure 3. Depletion of WASp, N-WASp or DIAPH1 leads to increase in replication fork collapse.
A. Representative images and dot plots of the number of 53BP1 foci per cyclin A positive HeLa cells treated with control siRNA (siCTRL) or siRNA targeting N-WASp, DIAPH1 or WASp upon HU treatment. Dot plots represent data pooled from three independent experiments. Statistical significance was determined using the Mann-Whitney test. Representative images and quantification of micronuclei formation in HeLa cells treated with control siRNA (−) or siRNA targeting N-WASp, DIAPH1 or WASp (+). Dot plots represent data pooled from at least three independent experiments. Bar charts represent mean +/− SEM of three experiments and statistical significance was determined using t test.

