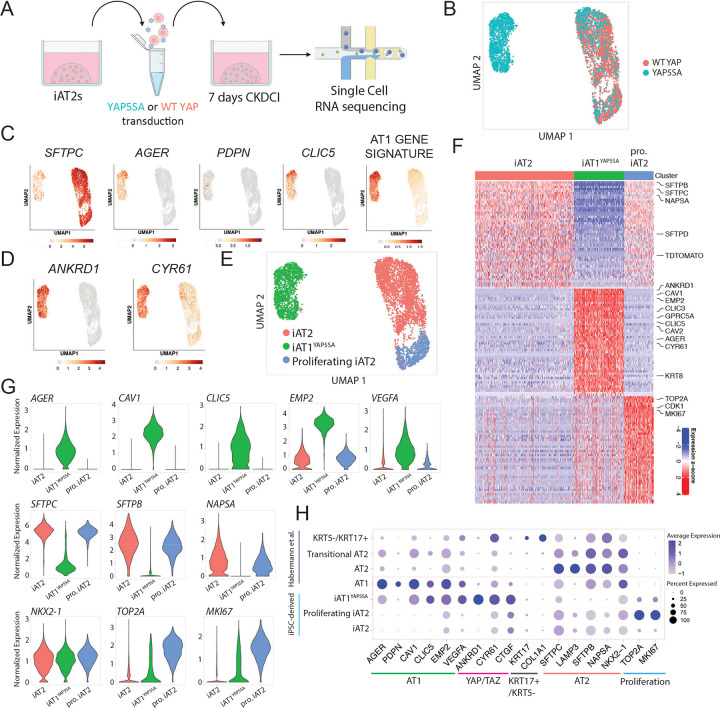
Figure 3: Nuclear YAP overexpression drives a shift from AT2 to AT1 programs in a cell autonomous manner.
A) Experimental schematic for single cell RNA sequencing of WT YAP and YAP5SA lentiviral transduced iAT2s 7 days post transduction. B) UMAP of transcriptomes profiled from WT YAP and YAP5SA exposed samples. C) Gene expression overlays of: AT2 marker SFTPC, AT1 markers AGER, PDPN, CLIC5, a 50 gene AT1 signature figure 1 (Supplemental Table 1), and D) YAP downstream target genes ANKRD1 and CYR61. E) Louvain clustering at resolution 0.05 identifies 3 indicated clusters. F) Top 50 differentially upregulated genes for the clusters shown in E. G) Gene expression of specific AT2, AT1, and proliferation markers across the clusters shown in E (“pro. iAT2”= proliferating iAT2s). H) Dot plot showing expression levels and frequencies of the indicated genes in iPSC-derived cells compared to scRNA-seq profiles of human adult primary AT1, AT2, Transitional AT2 and KRT5-/KRT17+ populations previously published by Habermann et al.2

