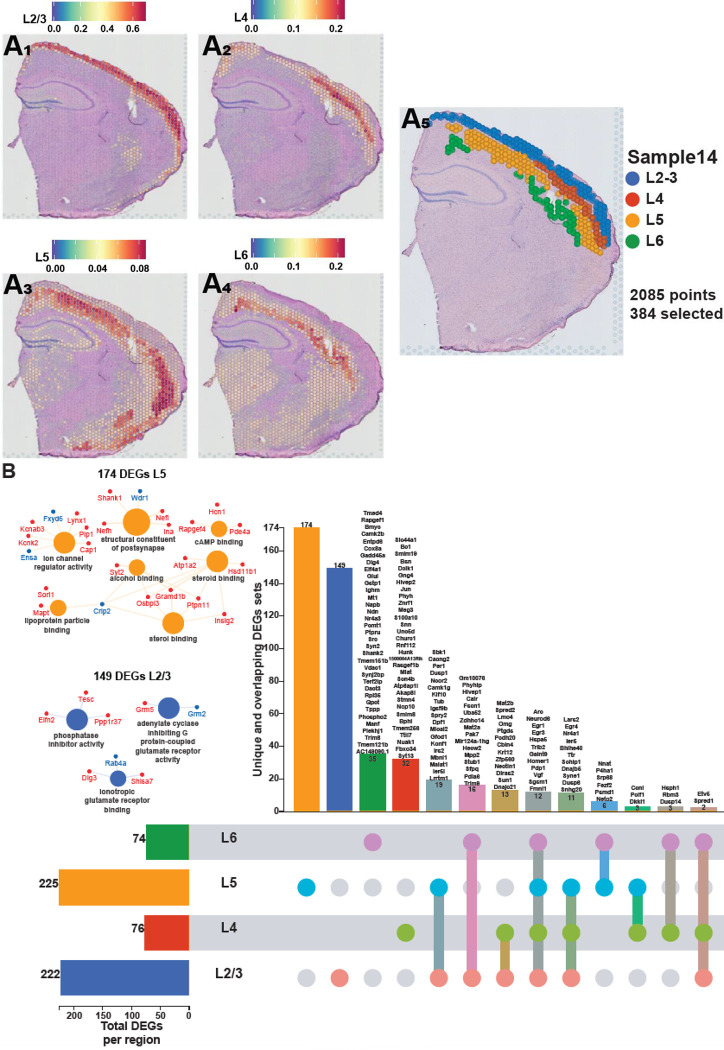
Figure 4. Each cortical layer of the neocortex displays a unique transcriptional impact of sleep deprivation.
A. Prediction score of the deconvolution step for each of the 2085 spots of a representative example slice for each cortical layer are represented with the color legend from blue to red: layer 2–3 (A1), layer 4 (A2), layer 5 (A3), layer 6 (A4). We can distinguish between distinct sequential laminar excitatory neurons layers on the aggregated profile (A5). B. UpSet plot of interactions between each deconvoluted cortical layers of the neocortex. The number of DEGs submitted for each layer is represented by the histogram on the left (0–225 range). A gene is significant if its FDR step-up < 0.001 and its log2fold-change ≥ |0.2|. Dots alone indicate no overlap with any other lists. Dots with connecting lines indicate one or more overlap of DEGs between cortical layers. The number of DEGs in a specific list of overlap is represented by the histogram on the top. Genes are labeled for the smallest lists. L2/3 = Layer 2 and 3 ; L4 = Layer 4 ; L5 = Layer 5 ; L6 = Layer 6. The unique lists of 174 DEGs for layer 5 and 149 DEGs for layer 2/3 that enrich specific molecular functions are listed on the left. The size of the circle for each enriched molecular function is proportional to the significance. Only molecular functions with a corrected p-value < 0.05 are displayed (two-sided hypergeometric test, Bonferroni step down). A gene is considered significant if FDR < 0.001 and log2fold change > |0.2|.

