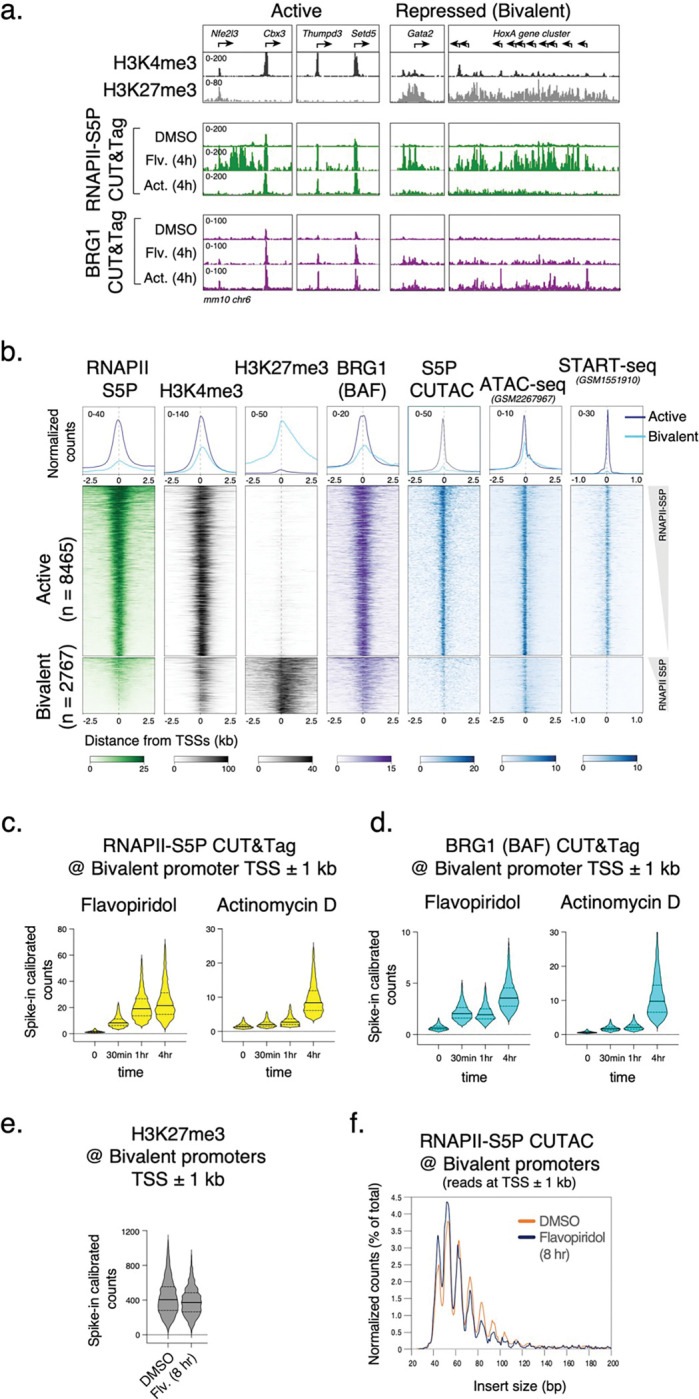
Fig. 3 |. Transcription inhibition show RNAPII and BAF occupancy at Polycomb-repressed gene promoters.

a, Representative genomic tracks comparing enrichment of histone modifications, RNAPII-S5P, and BRG1 by CUT&Tag at transcriptionally active and Polycomb-repressed bivalent genes, and changes in RNAPII-S5P and BRG1 occupancy upon Flavopiridol (Flv.) and Actinomycin D (Act.) treatment. RNAPII-S5P and BRG1 CUT&Tag read counts were spike-in calibrated. b, Heatmaps (bottom) and average plots (top) comparing histone modifications (CUT&Tag), chromatin structure (RNAPII-S5P CUTAC and ATAC-seq), and transcriptional activity (START-seq) at RNAPII-enriched (active) and H3K27me3-enriched (bivalent) promoters. Promoters were grouped based on K-means clustering of RNAPII-S5P and H3K27me3 CUT&Tag reads mapping to a 5 kb window around the TSSs of RefSeq-annotated mESC genes, see Extended Data Fig. 4a. c, d, Violin plots of spike-in calibrated CUT&Tag signal distribution comparing RNAPII-S5P and BRG1 occupancy over bivalent promoter TSSs ± 1 kb at time points after drug treatments. Median value (solid line), upper- and lower quartiles (broken lines) and outliers were calculated using the Tukey method. e, Violin plot comparing spike-in calibrated H3K27me3 CUT&Tag at bivalent promoter TSSs ± 1 kb in cells treated with DMSO and Flavopiridol. f, S5P CUTAC fragment size distribution to compare chromatin accessibility at bivalent promoter TSSs ± 1 kb in cells treated with DMSO and Flavopiridol. Datasets are representative of at least two biological replicates.
