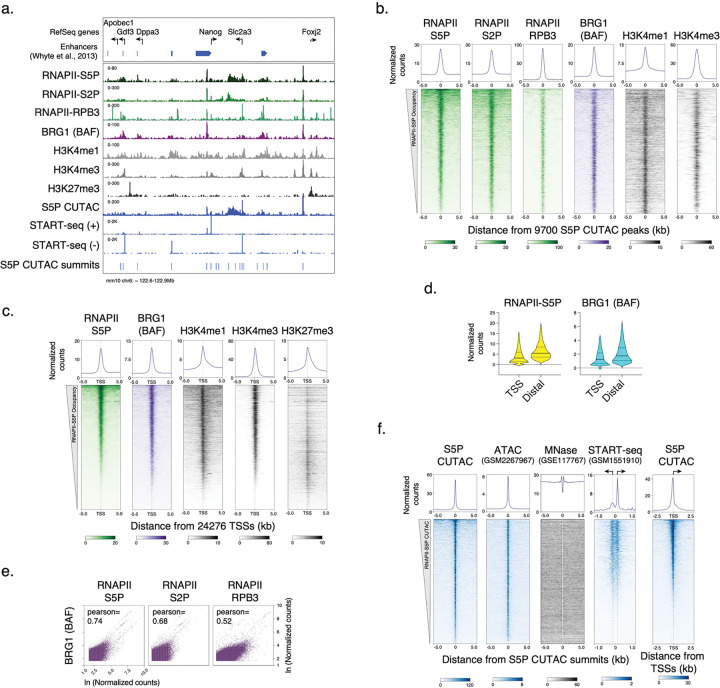
Extended Data Fig. 1 |. CUT&Tag of chromatin epitopes and RNAPII-S5P CUTAC in mESCs.
a, Representative genomic tracks showing RNAPII, BRG1, histone PTM occupancy by CUT&Tag, chromatin accessibility (RNAPII-S5P CUTAC), and transcriptional activity (START-seq) at the Nanog promoter and enhancer cluster and flanking genes. Previously annotated enhancer regions85 are shown on top. b, c, Heatmaps (bottom) and average plots (top) comparing RNAPII, BRG1, and histone PTM occupancy by CUT&Tag, relative to the primary peaks (summits) of RNAPII-S5P CUTAC (b) and RefSeq annotated gene TSSs (c), sorted by decreasing RNAPII-S5P occupancy. d, Violin plots of CUT&Tag signal distribution comparing RNAPII-S5P and BRG1 occupancy at gene promoters (TSS) versus promoter-distal S5P CUTAC peaks (Distal). Median value (solid line), upper and lower quartiles (broken lines) and outliers were calculated using the Tukey method. e, Scatterplots comparing BRG1 and RNAPII S5P, S2P, and RPB3 CUT&Tag reads in 1000 bp genome-wide consecutive non-overlapping bins. f, Heatmaps (bottom) and average plots (top) comparing chromatin accessibility (RNAPII-S5P CUTAC and ATAC-seq), nucleosome positions (MNase seq), and transcriptional activity (START-seq), relative to the primary peaks (summits) of RNAPII-S5P CUTAC; and RNAPII-S5P CUTAC signal relative to RefSeq annotated gene TSSs (extreme right). Datasets are representative of at least two biological replicates.

