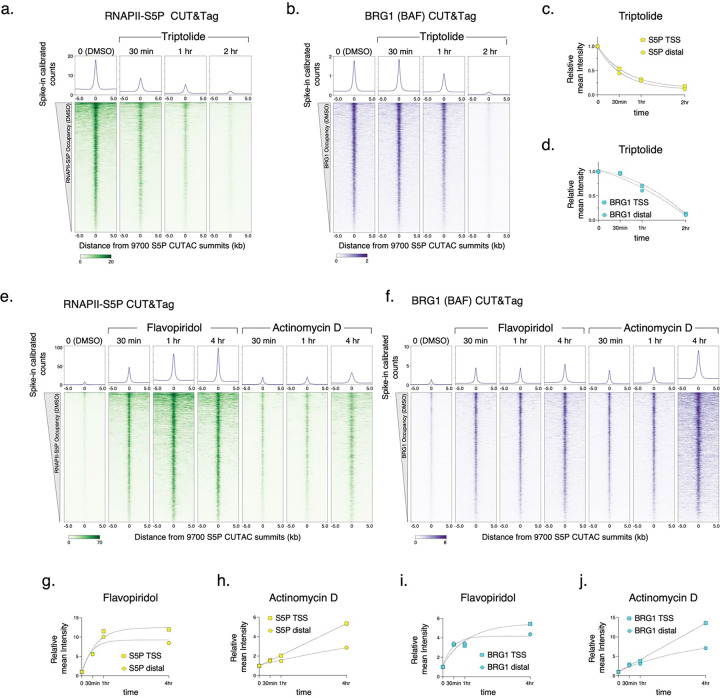
Extended Data Fig. 2 |. CUT&Tag of RNAPII-S5P and BRG1 after inhibitor treatment.
a, b, e, f, Heatmaps (bottom) and average plots (top) comparing RNAPII-S5P and BRG1 occupancy by spike-in calibrated CUT&Tag relative to the primary peaks (summits) of RNAPII-S5P CUTAC in untreated cells (DMSO) versus cells treated with Triptolide (a, b), Flavopiridol, and Actinomycin D (e, f) at indicated time points post drug treatment. c, d, g-j, Comparison of fold changes in mean RNAPII-S5P and BRG1 occupancy (spike-in calibrated CUT&Tag) at gene promoters (TSS, squares) and promoter-distal CUTAC peaks (Distal, circles) at time points after drug treatments. Datasets are representative of at least two biological replicates.

