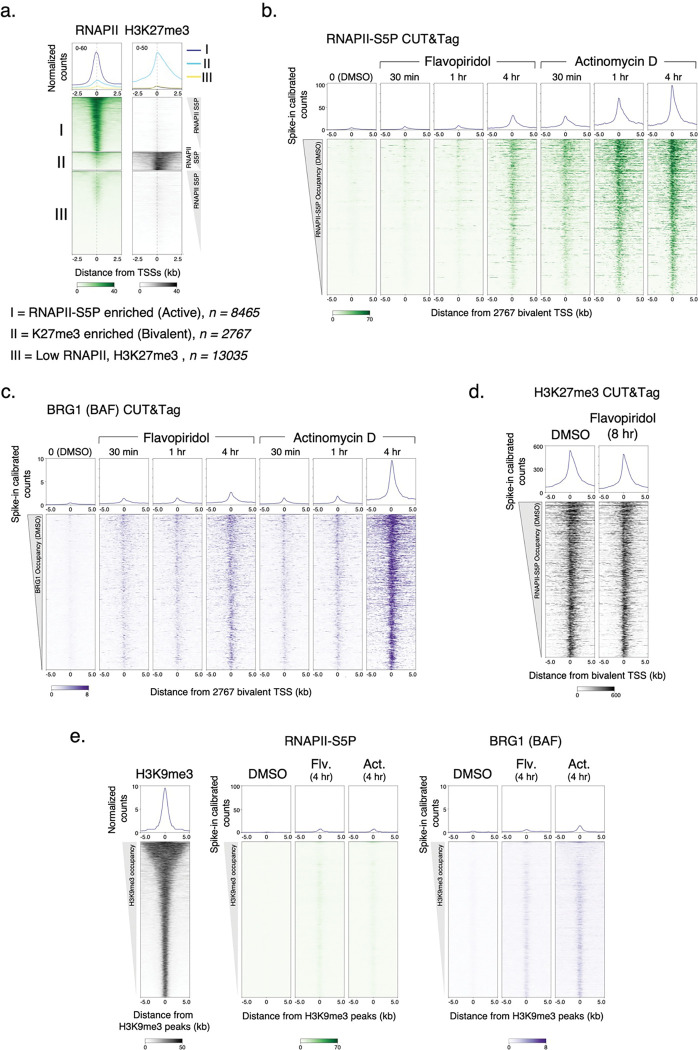
Extended Data Fig. 4 |. CUT&Tag of RNAPIIS5P and BRG1 at bivalent promoters.
a, K-means clustering of RNAPII-S5P and H3K27me3 CUT&Tag reads relative to RefSeq annotated gene promoter TSSs to group promoters as active (I, RNAPII-S5P enriched) and bivalent (II, H3K27me3 enriched), and not enriched for either (III). b, c, Heatmaps (bottom) and average plots (top) comparing RNAPII-S5P and BRG1 occupancy by spike-in calibrated CUT&Tag relative to bivalent promoter TSSs in untreated cells (DMSO) versus cells treated with Flavopiridol or Actinomycin D at indicated time points post drug treatment. d, Heatmaps (bottom) and average plots (top) comparing H3K27me3 occupancy by spike-in calibrated CUT&Tag relative to bivalent promoter TSSs in untreated cells (DMSO) and cells treated with Flavopiridol. e, Heatmaps (bottom) and average plots (top) comparing H3K9me3 occupancy (CUT&Tag) with RNAPII-S5P and BRG1 relative to H3K9me3 peaks in untreated cells (DMSO) versus cells treated with Flavopiridol or Actinomycin D. RNAPII-S5P and BRG1 CUT&Tag reads were spike-in calibrated and plotted to the same scales as in panels b and c, respectively. Datasets are representative of at least two biological replicates.

