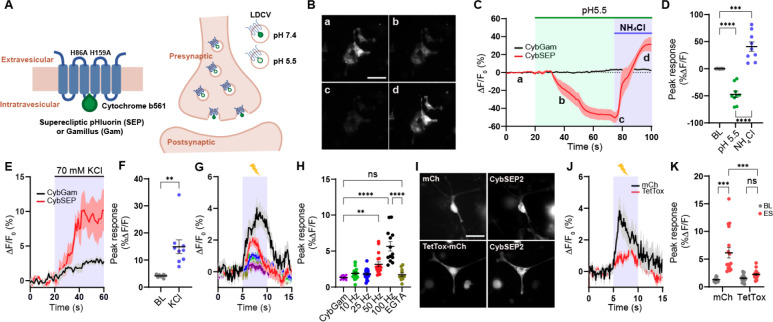
Figure 1. Design and characterization of CybSEP as an LDCV sensor.
(A) Schematic of constructs and working principle.
(B) Representative images of CybSEP expression in differentiated PC12 cells when perfused with acidic and NH4Cl solutions, described in (C) (a, bath solution; b and c, acidic solution; d, NH4Cl; Scale bar, 100 μm).
(C) The traces of CybSEP and CybGam fluorescence change during application of various extracellular solutions.
(D) Quantification of percent ΔF/F0 peak intensity in CybSEP expressing PC12 cells (n= 9 over 3 experimental replicates; ***p < 0.001, ****p < 0.0001 via one-way ANOVA followed by Tukey’s multiple comparisons). BL indicates baseline.
(E and F) Average trace of fluorescence change during 70 mM KCl treatment and quantification of percent ΔF/F0 peak intensity in (E) (n=8–10 over 2 experimental replicates; **p < 0.01 via paired t test to the baseline).
(G and H) Average traces of fluorescence change during various electrical stimulation and quantification of percent ΔF/F0 peak intensity in (G). For extracellular calcium removal, 5 mM EGTA was used instead of CaCl2 (n=11–19, over 3 experimental replicates; **p < 0.001, ****p < 0.0001 via one-way ANOVA followed by Tukey’s multiple comparisons).
(I) Representative images of CybSEP2 with mCherry (mCh) or TetTox-mCh expressed in PC12 cells (Scale bar, 100 μm)
(J and K) Average traces of fluorescence change in CybSEP2 co-expressed with mCh or TetTox-mCh during electrical stimulation at 100 Hz and quantification of percent ΔF/F0 peak intensity in (J) (n=19–23, 3 over 3 experimental replicates; ***p < 0.0001 via two-way ANOVA followed by Šidák multiple comparisons). Data are represented as mean ± SEM.

