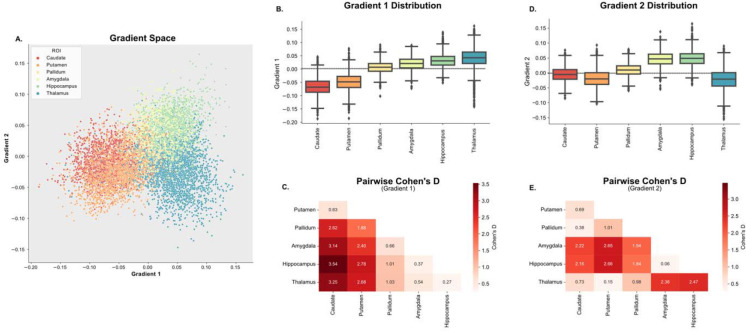
Figure 3– Overview of the Subcortical Functional Gradients:
A. Average gradient space generated by principal gradient 1 and 2 across all TLE subjects. Different colors represent different subcortical regions of interest (ROIs). Ipsilateral and contralateral structures are assigned the same color in this representation. B.,C. Boxplots representing the distribution across ROIs for gradient 1 (B.) and gradient 2 (C.). D., E. Pairwise Cohen’s D values between each ROI for gradient 1 (D.) and gradient 2 (E.). Differences between all ROIs were statistically significant (pBON < 0.05)

