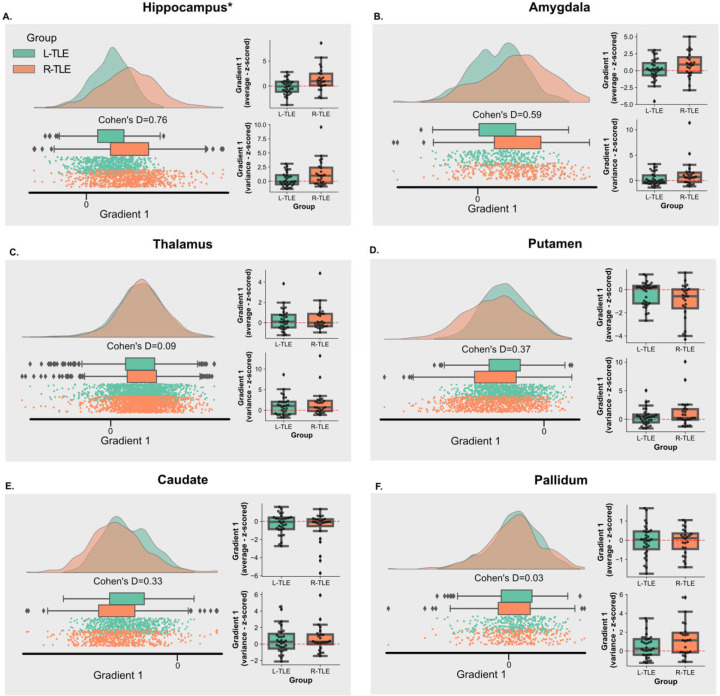
Figure 5– Principal Gradient 1 Across Ipsilateral Subcortical ROIs:
A-F. Each panel represents a different subcortical ROI, and they show both, the average distribution in gradient space for gradient 1 across subjects in each group (left), and the distribution of individual gradient 1 mean and variance for subjects in each group (right). The individual subject mean and variance were z-scored relative to the distribution of gradient 1 mean and variance for controls in the same ROI, but across bilateral regions.

