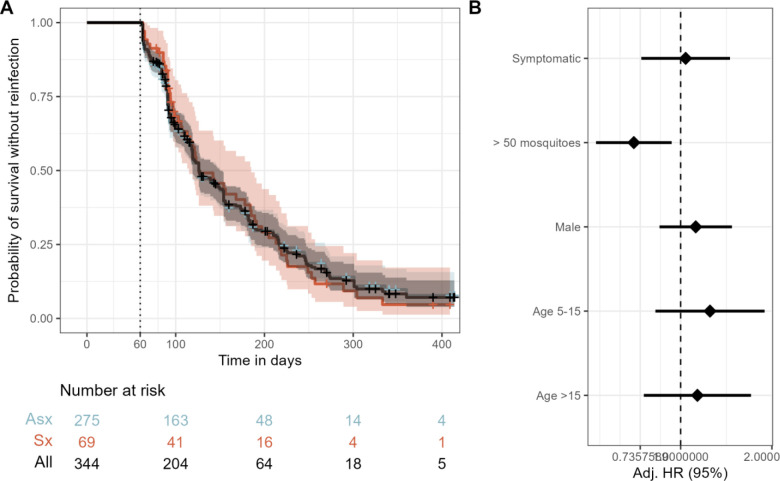
Figure 2. Risk of reinfection overall and as a function of symptomaticity of the index infection.
A) Kaplan-Meier survival curve of time to reinfection with P. falciparum. The black line is the probability among all participants, and colored lines are probability stratified by index case as either asymptomatic (Asx, blue) or symptomatic (Sx, red). Note that the blue line is largely hidden by the black line. Crosses indicate infections that were not followed by a reinfection and therefore censored at the end of the study period. Vertical dotted line indicates the start of the defined time at risk of re-infection, shaded areas indicate the 95% confidence interval, and table shows the number of participants at risk stratified by symptomaticity of index infection at day 0, 100, 200, 300, and 400. B) Adjusted Hazard Ratios for reinfection estimated by a multivariate mixed effects Cox proportional hazards model. Diamonds indicate adjusted HRs, and bars show the 95% CIs. Adj. HR: Adjusted Hazard Ratio

