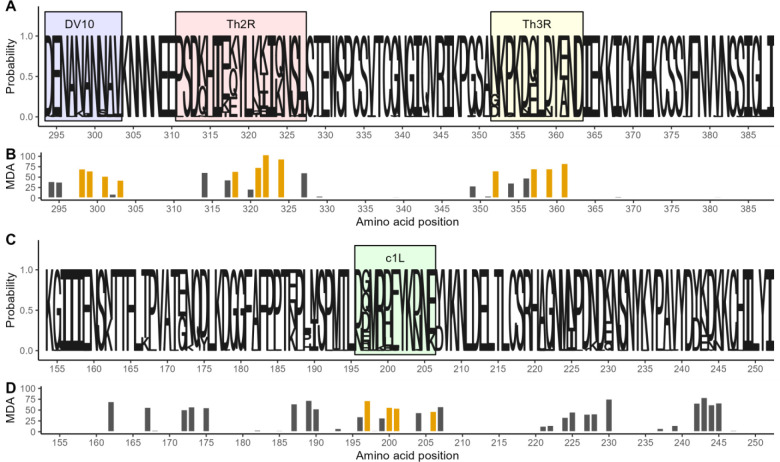
Figure 3. Amino acid diversity of sequenced pfcsp and ama1 fragments.
A) Sequence logo of the observed circumsporozoite protein (CSP) amino acid variation. The size of the letters at each position shows the probability of the specific residue. Boxes indicate the positions of known epitopes for B-cells (DV10, blue), CD4+ T-cells (Th2R, red) and CD8+ T-cells (Th3R, yellow). B) Result of a random forest model used to predict the whole CSP fragment nucleotide sequence using amino acid variation. Bar height indicates for each variant amino acid position the mean decrease in accuracy (MDA) of prediction. Gold indicates the four most predictive amino acid positions within each T-cell epitope. C) Sequence logo of the observed apical membrane antigen 1 (AMA-1) amino acid variation. The size of the letters at each position shows the probability of the specific residue. Green box marks the c1L domain. D) The mean decrease in accuracy for each variant amino acid position in a random forest model used to predict the whole AMA-1 fragment nucleotide sequence. Gold indicates the four most predictive amino acid positions within the c1L domain.

