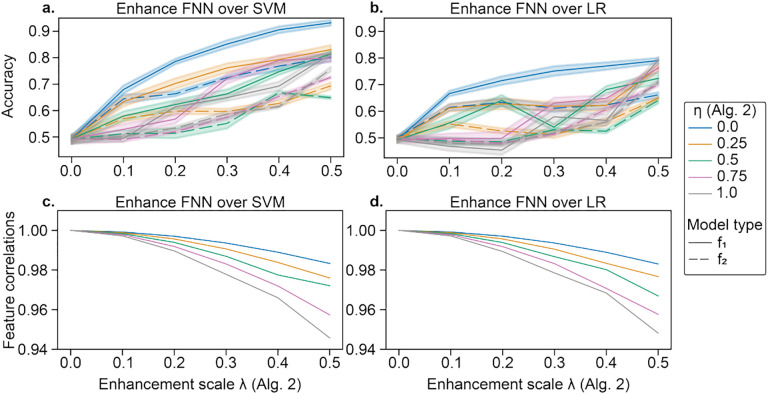
Fig.3.
Enhancement of a FNN over a,c) SVM and b,d) LR in CNP. In a,b), data are enhanced with increasing λ (see Algorithm 2). Solid lines represent the accuracy for f1 (FNN), while dashed lines show the accuracy for f2 (SVM in a and LR in b). Error bars reflect standard deviation across 10 random seeds of k-fold cross-validation initialization seeds for FNN. Line color shows the suppression coefficient for f2, η. In c,d), the correlation between original and enhanced features is shown with increasing λ. The original and enhanced features are highly correlated (r′s > 0.94).

