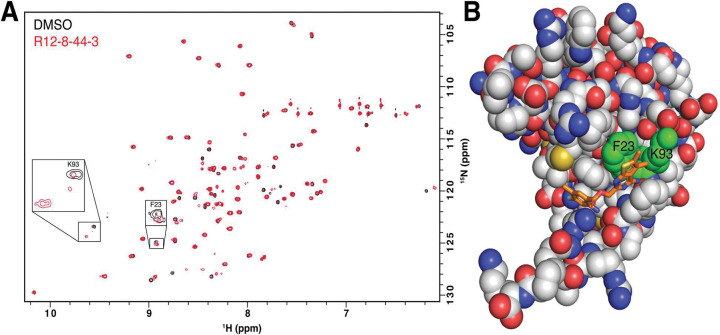
Figure 3: Structural characterization of R12–8–44–3 / MSI1.
(A) HSQC spectrum of MSI1 RRM1 collected in the presence (red) or absence (black) of R12–8–44–3. Assigned peaks showing the strongest chemical shift difference are labeled (Phe23, Lys93). (B) Mapping the location of these residues to our model of R12–8–44–3/MSI1 confirms that these residues comprise the intended binding site.

