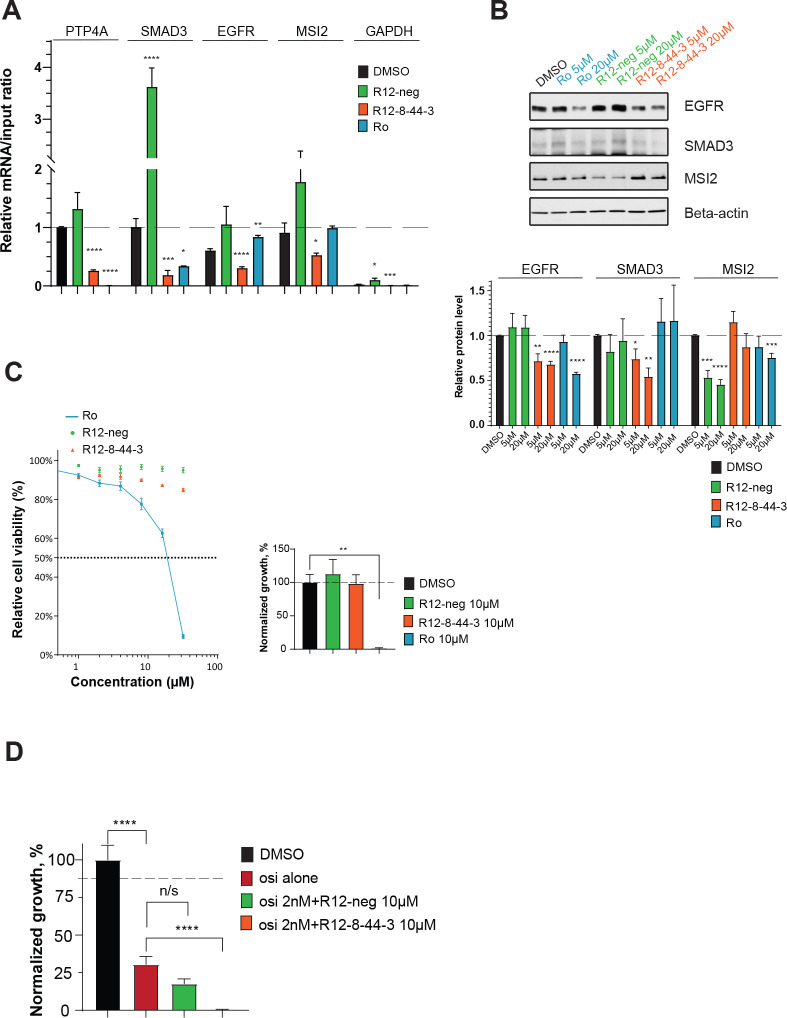
Figure 7: Cellular characterization of MSI2 inhibition by R12–8–44–3.
(A) Quantification of mRNA immunoprecipitation (RIP) results. Cells were treated with 10 μM of the indicated compounds for 8 hours. After immunoprecipitation with anti-MSI2, mRNA targets were quantified. The amount of each target mRNA in the pulldown was calculated relative to the input, and results from all targets were normalized to PTP4A1. Treating cells with R12–8–44–3 disrupted the interaction with all four cognate mRNAs (PTP4A, SMAD3, EGFR, and MSI2). Data are presented as the average ± S.E.M. from at least 3 independent replicates. (B) Immunoblot from PC9 cells treated with Ro (positive control), R12-neg (negative control), or R12–8–44–3. Cells were treated with indicated compounds at two concentrations (5 μM and 20 μM) for 48 hours, then protein levels of relevant MSI2 targets were determined (EGFR, SMAD3, and MSI2). One representative image is shown; quantification is presented as the average ± S.E.M. from at least 3 independent replicates, normalized first to beta-actin and then to DMSO-treated cells. (C) Cell viability dose-response quantified by CellTiter-Blue after 3 days (left) and cell proliferation with 10μM of compounds quantified by clonogenic assay after 7 days (right). Each is normalized to DMSO control, and presented as the average ± S.E.M. from 3 independent replicates. (D) Cell viability quantified by clonogenic assay of PC9 cell line after 7-day treatment with 2 nM osimertinib (osi alone), osimertinib with 10 μM R12–8–44–3, or osimertinib with 10 μM R12-neg. Data are normalized to DMSO, and are presented as the average ± S.E.M. from 9 independent replicates. Statistical analysis was performed using unpaired two tailed t-test. In all plots, * indicates p<0.05, ** indicates p<0.01, *** indicates p<0.001, and **** indicates p<0.0001.

