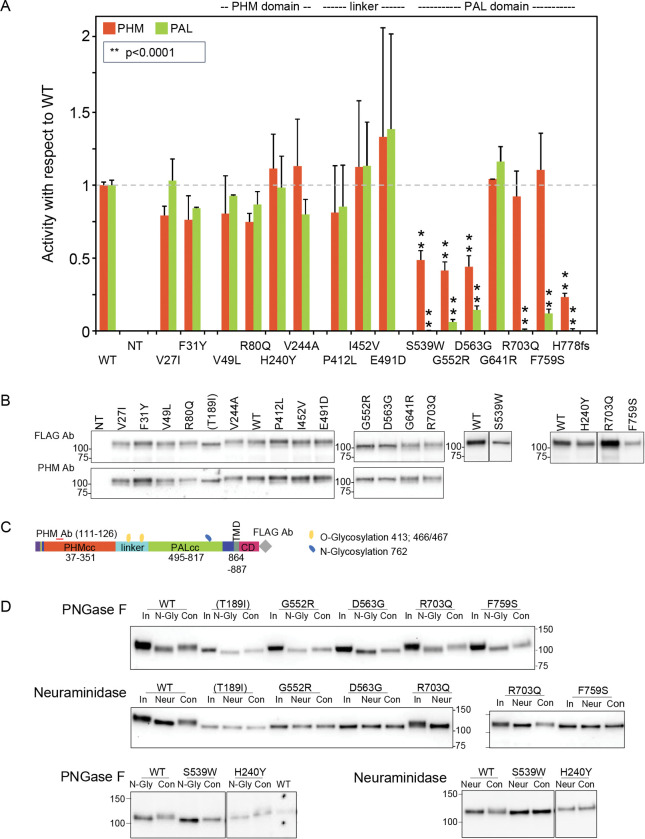
Figure 3. Enzymatic activity, protein expression, and glycosylation pattern of PAM variants.
(A) PHM and PAL activity. As described in Methods, TMT solubilized particulate fractions prepared from transiently transfected PEAKrapid cells were assayed for PHM activity and for PAL activity. Data for the level of expression of WT PAM and each full-length variant were determined by quantifying the FLAG-tag signal. Levels of p.His778fs were assessed as described in Methods. NT, not transfected; WT, wild-type; **p < 0.0001. (B) PAM protein expression. SNV expression was assessed using a FLAG tag antibody and an antibody to a peptide contained in PHMcc (JH246). The lines separating WT and p.His240Tyr from p.Arg703Gln and p.Phe759Ser indicate that data for two intervening samples were removed. Molecular weight standards are indicated. (C) PAM protein diagram, indicating the location of the JH246 epitope (red horizontal line), the FLAG tag (grey diamond), and the expected location of N- and O-glycans (blue and yellow freeform shapes, respectively). (D) Glycosylation is altered in a subset of PAM variants. Cell lysates were treated with PNGase F or neuraminidase as described in Methods. Proteins were visualized using the FLAG antibody. The samples treated with Neuraminidase were analyzed on two separate gels, with the p.Arg703Gln samples appearing in part on both gels. Con, control; In, Input; N-Gly, PNGase; Neur, neuraminidase; NT, not transfected.

