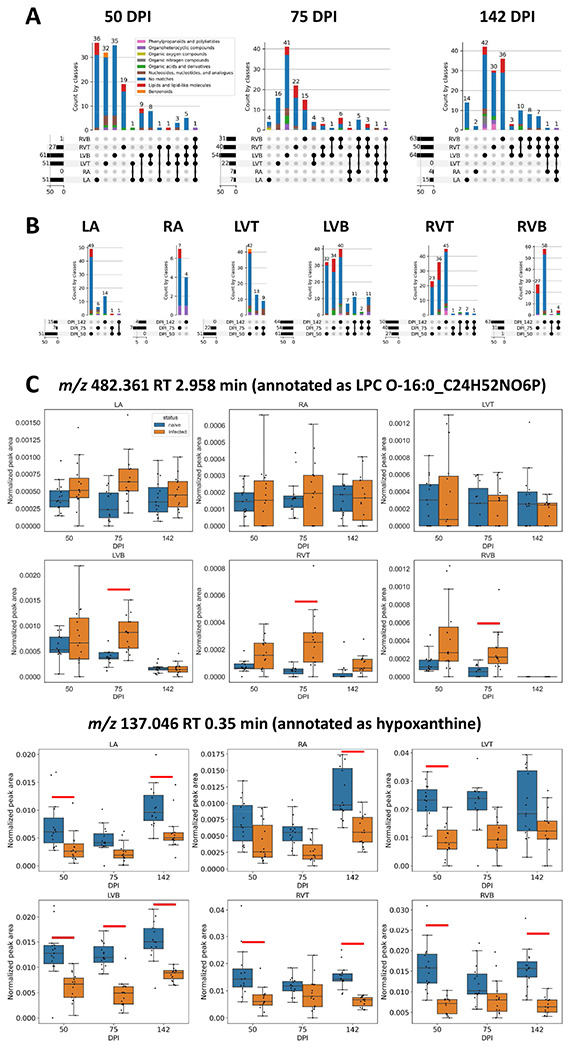
Figure 2. Impact of infection progress on individual metabolites.

(A) UpSet plot demonstrating limited overlap between infection-impacted metabolites at each heart section, for each timepoint post-infection. Bars are colored by superclass from ClassyFire annotation, as implemented in MolNetEnhancer 46,45. Dark circles represent intersections between groups, with the size of that intersection on top of the colored bar graph. Total number of features impacted by infection at each sampling site is represented on the left barplot. (B) UpSet plot demonstrating limited overlap between infection-impacted metabolites at each timepoint, for each of the heart sections. (C) Representative metabolites locally impacted by infection over time. Red line, p-value <0.05 by Mann-Whitney U Test, FDR-corrected. N=15 mice per group and per position.
