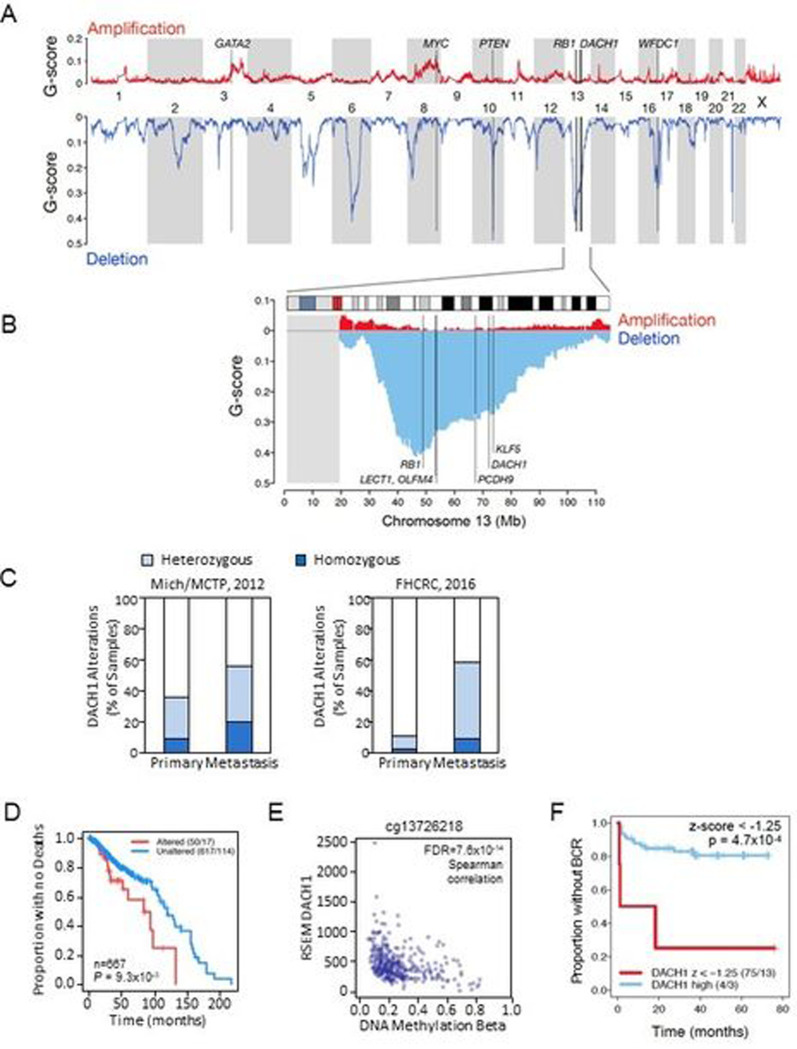
Figure 1. The DACH1 gene is deleted in human prostate cancer.
(A). Landscape of somatic copy number alteration (SCNA) [26] in the TCGA PCa cohort (firebrowse.org) shown as profiles of GISTIC2 G-scores [76] for GRCh37/hg19 SNP6-based data for n=492 primary tumors. (B) as from (A), for chromosome 13, vertical lines indicate positions of candidate tumor suppressor genes (TSGs) PCDH9-DACH1-KLF5. The grey rectangle at the left indicates that TCGA/firebrowse.org reported no GISTIC2 data for the 13p arm. (C). Analysis of DACH1 gene status in human prostate cancer (PCa) from two cBioPortal cohorts (for which copy number data was available for primary and the metstatic sites) shows DACH1 homozygous deletions (dark blue) in 2.3% to 20% of patients and a higher frequency of heterozygous deletions (light blue). (D). DACH1 copy number and overall survival data was determined by combining three cBioPortal cohorts (TCGA PanCancer Atlas 2018, SU2C 2019, and MCTP) (N=667 tumor samples). Kaplan-Meier plot for overall survival is shown using a copy number threshold of −2 to segregate the data into samples with altered vs. unaltered DACH1 [26]. Patients with homozygous DACH1 deletions (“Altered” in the figure caption) showed reduced overall survival (log-rank P<9.3 ×10⁻³) (“Altered” 50/17 vs. “Unaltered” 617/114). The numbers (50/17, 617/114) indicate the number of samples in the group (e.g., Altered = 50, Unaltered = 617) and the number of events, i.e., for overall survival, deaths (e.g., Altered = 17, Unaltered = 114). (E). The range of DNA methylation beta values for probe cg13726218 (reported for DACH1 at cBioPortal) and RNA-Seq by Expectation Maximization (RSEM) DACH1 normalized expression (n=333 cohort) [26]. The (negative) Spearman correlation between beta and RSEM DACH1 normalized expression was rho=−0.41, FDR=7.6×10⁻¹⁴. (F). Kaplan-Meier plot data from Gerhausen et al.[27] showing low DACH1 gene expression (expressed as a z-score with a z-score threshold of −1.25 ) is significantly correlated with earlier biochemical recurrence (BCR). (log rank p value = 4.7×10⁻⁴ (n=79).

