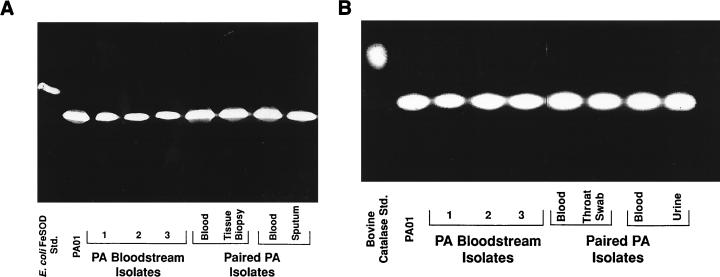
FIG. 1.
Native (nondenaturing) PAGE analysis demonstrating SOD and catalase activities and migration patterns for P. aeruginosa (PA) strains grown to log phase in TSB. Shown are SOD activities (A) and catalase activities (B) of the PAO1 laboratory strain, three separate bloodstream isolates, and paired local and bloodstream isolates taken from the same patient. Also shown on the far left of each gel is a positive control: E. coli FeSOD (A) or bovine catalase (B). Results are representative of those obtained with all of the clinical isolates examined (71 for SOD and 41 for catalase). Std., standard.

