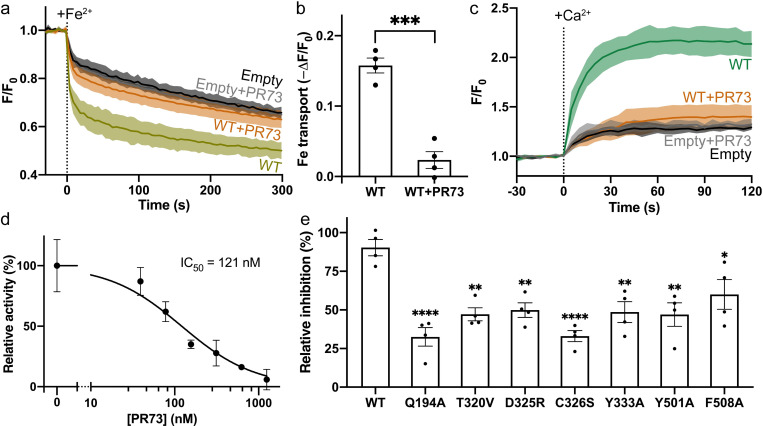
Fig 7. Inhibition of Fe2+ and Ca2+ transport by PR73.
(a) Time-dependent Fe2+ uptake by HEK cells expressing WT Fpn. Approximately 100 μM Fe2+ (stabilized by 1 mM ascorbic acid) was administered at time zero. (b) Fpn-specific Fe2+ transport from data in (a). Each bar represents the change in fluorescence in WT after subtraction of that in empty vector control. Unpaired Student’s t test, p < 0.005. (c) Time-dependent Ca2+ uptake by HEK cells with or without HsFpn. Approximately 500 μM of Ca2+ was administered at time zero. The presence of 2 μM PR73 inhibits the transport. (d) Inhibition of Ca2+ transport by Fpn at different concentrations of PR73. (e) Relative inhibition of PR73 against HsFpn mutants. Dunnett’s test was used as a post hoc test following one-way analysis of variance with the WT as control. In (a) and (c), the solid lines represent the mean (n = 4) and the shaded areas the SD. In (b), (d), and (e), data are plotted as means with error bars representing the SEM. The solid black line in (d) is the fit of data to a single-binding site inhibition equation. Statistical significances are indicated: *, p < 0.05; **, p < 0.01; ***, p < 0.005; ****, p < 0.001. Source data for (a–e) can be found in S1 Data. HEK, human embryonic kidney; SEM, standard error of the mean; SD, standard deviation; WT, wild type.

