. 2023 Jan 23;31:e20220313. doi: 10.1590/1678-7757-2022-0313

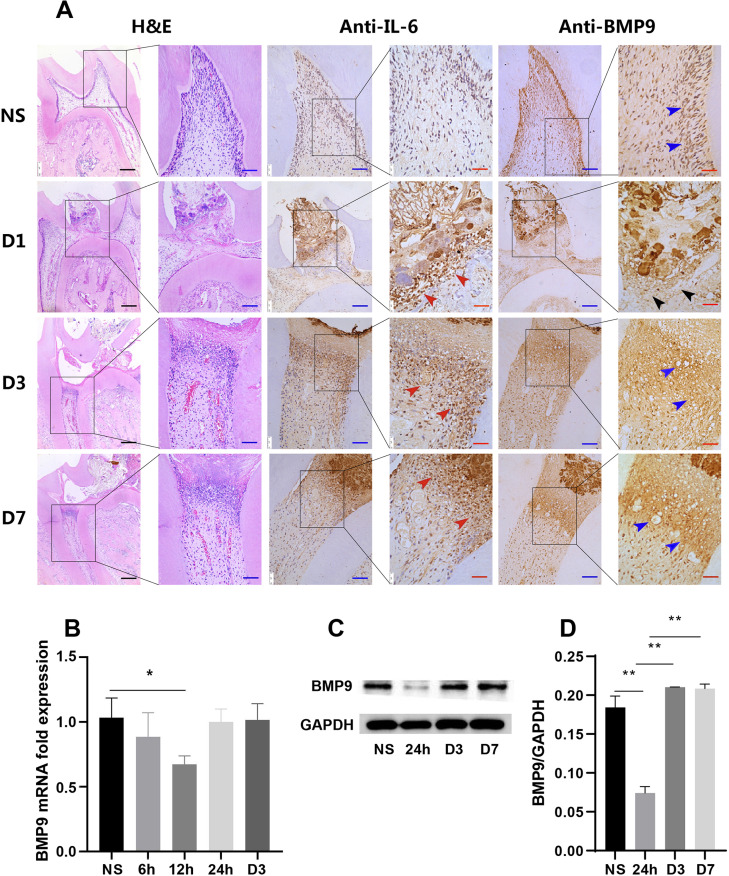
Figure 1. The expression of BMP9 in rat pulpitis and hDPCs. (A) H&E showed the occurrence and development of rat pulpitis at different time points; IHC showed the expression of BMP9 (blue and black arrows) and IL-6 (red arrows). (B) RT-qPCR showed that the mRNA expression of BMP9 significantly decreased in Pg-LPS-stimulated hDPCs at 12 h and then recovered. (C) WB showed that the protein levels of BMP9 decreased at 24 h, which is later than the gene decline time, in line with IHC results. (D) Quantitative analysis of WB results. NS: normal sample. Bars represent mean±SD (n=5). * p<0.05; ** p<0.01. Black scale bars: 200 μm; blue scale bars: 50 μm; red scale bars: 25 μm.

Figure 1