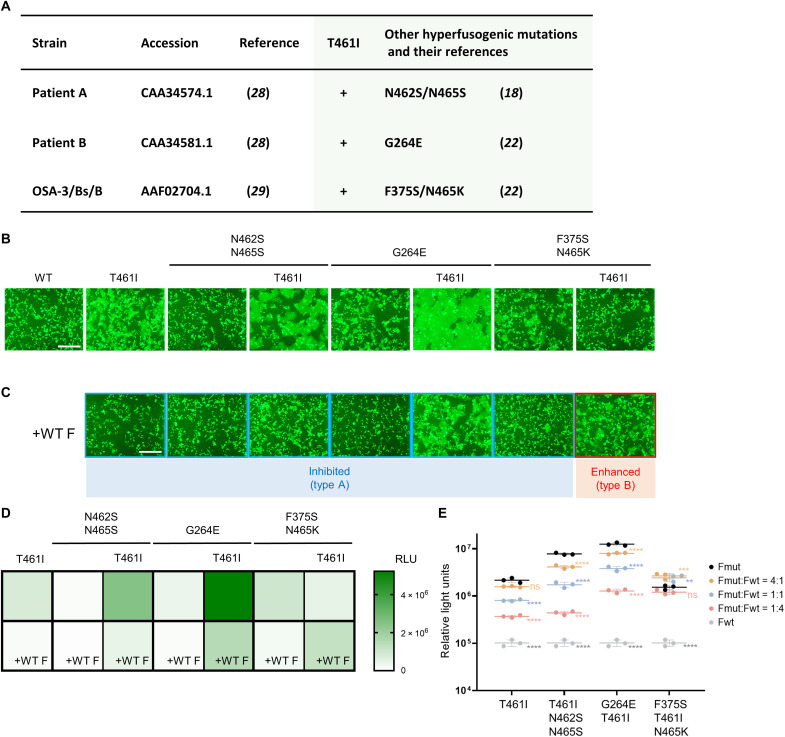
Fig. 1. Influence on the F fusogenicity of cumulative mutations and the WT F protein coexpression.
(A) The MeV isolates from patients with SSPE who have the T461I substitution and other hyperfusogenic mutations in the F protein. Their strain names, accession numbers (GenBank) and references, other hyperfusogenic mutations, and references for the mutations are shown. (B and C) The WT H protein, MeV F [WT F, F(T461I), F(N462S/N465S), F(T461I/N462S/N465S), F(G264E), F(G264E/T461I), F(F375S/N465K), or F(F375S/T461I/N465K)], CADM1, and EGFP were expressed in 293FT cells without (B) or with (C) the WT F protein. The cells were observed 24 hours after transfection under a fluorescence microscope. Scale bars, 500 μm. For type A and type B, refer to the main text and fig. S8. (D and E) The WT H protein, MeV F [F(T461I), F(N462S/N465S), F(T461I/N462S/N465S), F(G264E), F(G264E/T461I), F(F375S/N465K), or F(F375S/T461I/N465K)], and CADM1 were expressed in mixed 293FT/DSP1 and 293FT/DSP2 cells without or with the WT F protein. The ratio of each mutant F protein to the WT F protein was 1:1 (D) or 4:1, 1:1, or 1:4 (E). The Renilla luciferase activity in the transfected cells was analyzed 24 hours after transfection. RLU, relative light units. Each data point represents one biological replicate (N = 3). Error bars indicate SDs. Significance of the difference in the luciferase activity (as compared with that obtained by the expression of the corresponding mutant F protein only) was analyzed by two-way ANOVA: ns, not significant; *P < 0.05, **P < 0.01, ***P < 0.001, and ****P < 0.0001.

