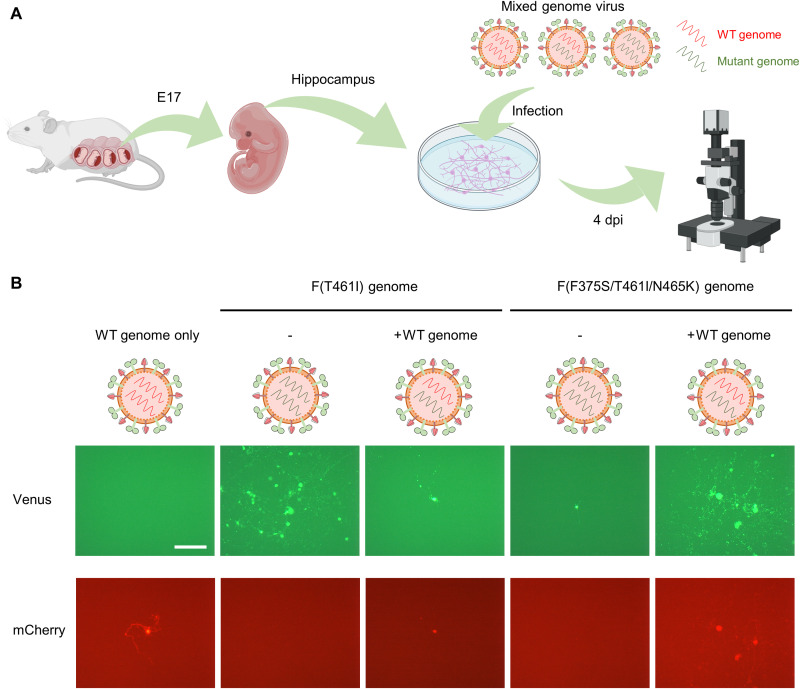
Fig. 3. Infection of mouse primary neurons with mixed genome MeVs.
(A) Schematic diagram of the experimental procedures for the isolation of mouse hippocampus primary neurons and infection with mixed genome viruses. Created with BioRender.com. E17, embryonic day 17. (B) Mouse primary neurons were infected with the MV323-mCherry (WT) or one of mixed genome viruses [MV323-mCherry + MV323-Venus-F(T461I) and MV323-mCherry + MV323-Venus-F(F375S/T461I/N465K)] at an MOI of 0.0001, and the cells were observed 4 days post infection (dpi) under a fluorescence microscope. Scale bar, 200 μm.

