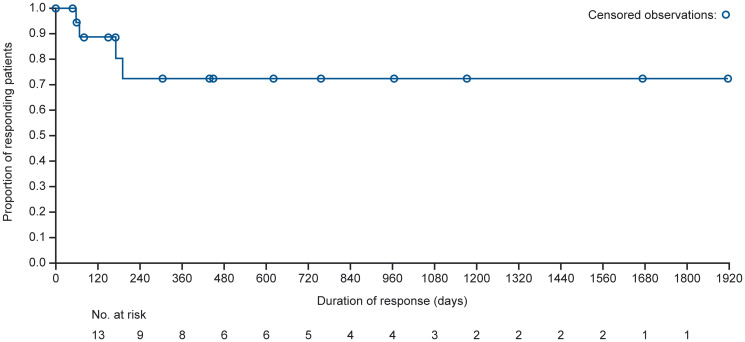
Figure 2. Kaplan–Meier curve for estimated median DOR in the DLBCL combined cohort (response-evaluable population).
DOR was defined as the time from the date of first documentation of PR or better to the date of first documentation of PD or relapse. Among patients with CR, no patients had a PD/relapse event, and data were censored with a range of less than one month (1 day) to 63.0 months with responses ongoing for all 14 patients at the time of data cut. Among patients with PR, 4 patients had a PD/relapse event, and data were censored for the remaining 8 patients.

