
Figure 2.
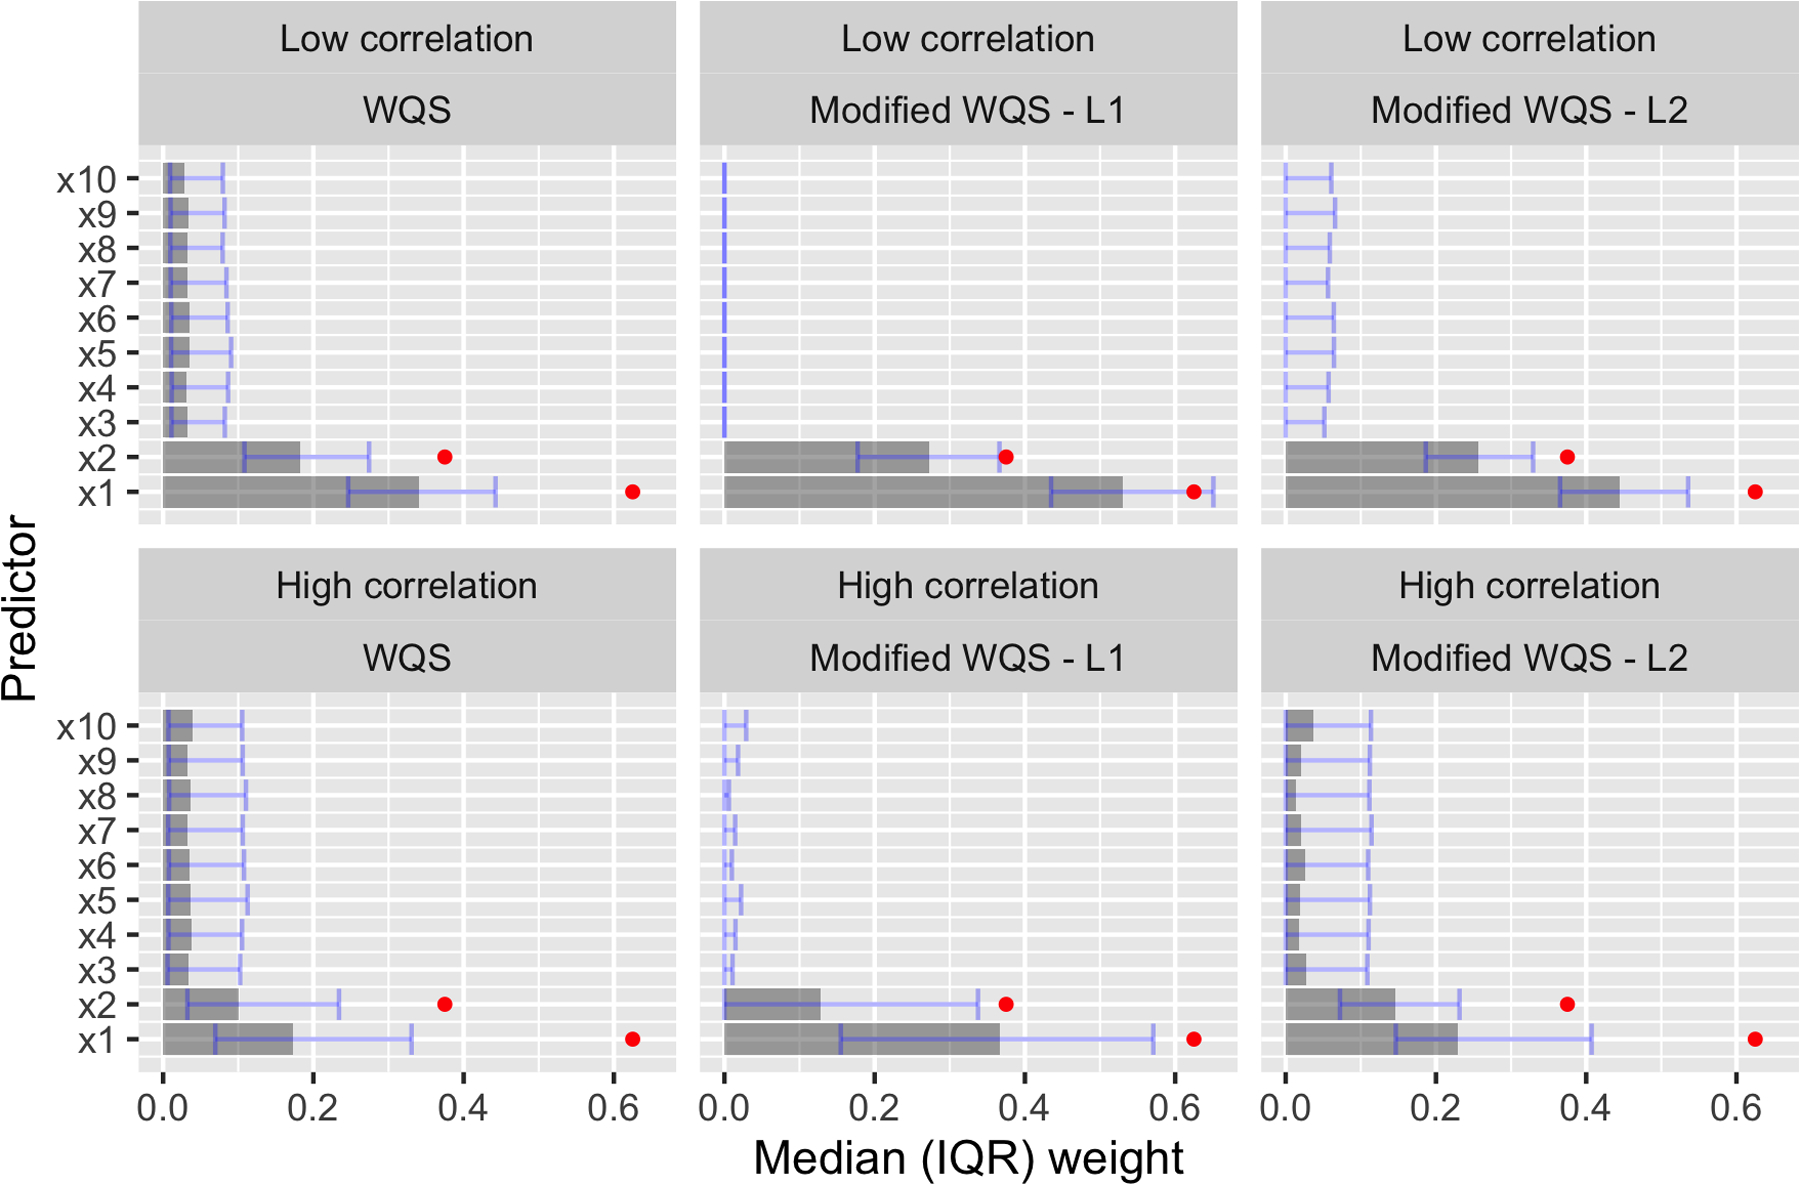
Scenario 1, R2 = 0.1: Median estimated weights with bars from the 25th to the 75th percentile. Weights were estimated using training data for WQS and full data for our method. True weights are shown in red.
Official websites use .gov
A
.gov website belongs to an official
government organization in the United States.
Secure .gov websites use HTTPS
A lock (
) or https:// means you've safely
connected to the .gov website. Share sensitive
information only on official, secure websites.
Scenario 1, R2 = 0.1: Median estimated weights with bars from the 25th to the 75th percentile. Weights were estimated using training data for WQS and full data for our method. True weights are shown in red.