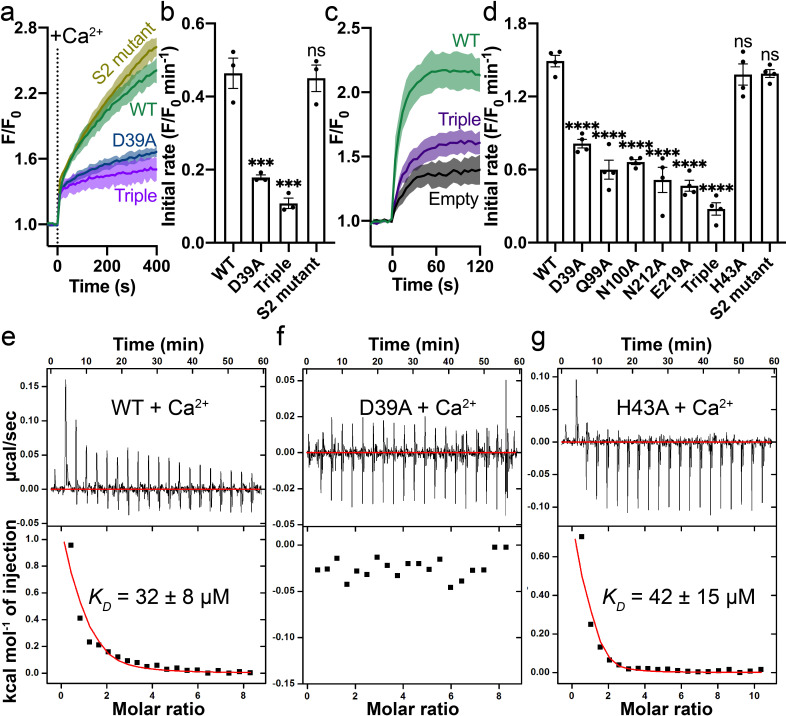
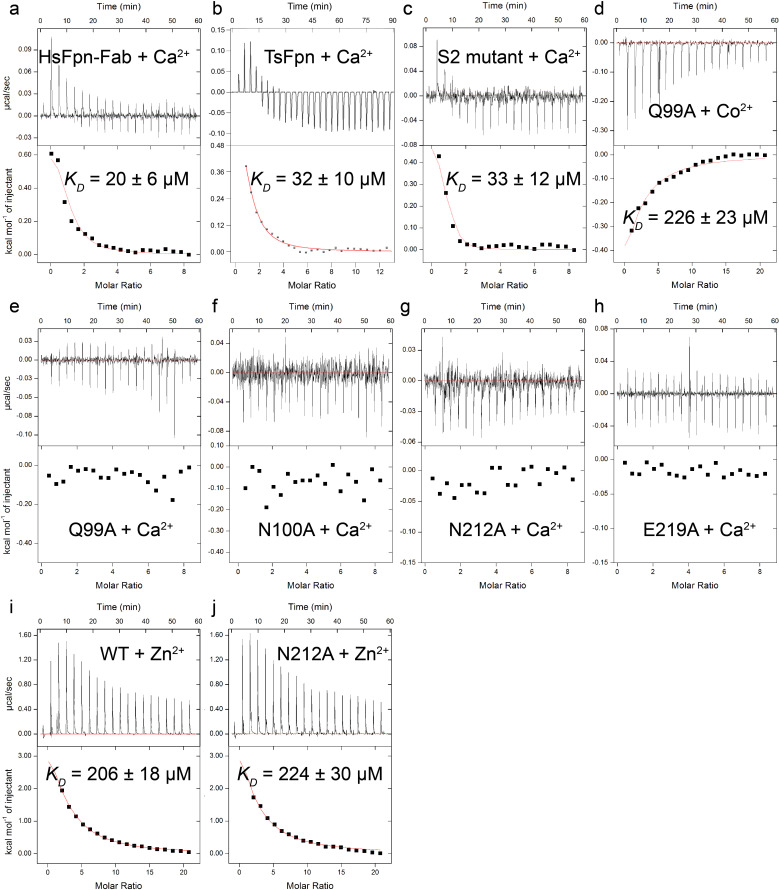
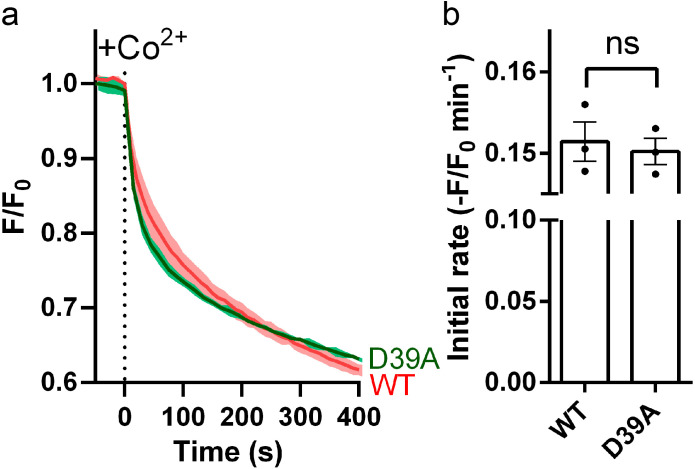
Figure 3. Mutations on the Ca2+ binding site.
(a) Ca2+ influx by WT (green), D39A (blue), and the triple mutant (Q99A_N100A_E219A, purple) of the Ca2+ binding site in proteoliposomes. (b) Comparison of initial rates of Ca2+ influx in (a). (c) Ca2+ uptake in HEK cells expressing WT (green) or the triple mutant (purple) Fpn. (d) Fpn-specific Ca2+ transport activities of WT and mutants. Initial rates are subtracted from the empty control. For statistical significances in (b) and (d), Dunnett’s test was used as a post hoc test following one-way ANOVA with the WT as the control. 500 µM Ca2+ was used in (a–d). Binding of Ca2+ to WT (e), D39A (f), and H43A (g) HsFpn measured by ITC. Upper plot: raw thermogram showing the heat during binding and baseline (red line). Lower plot: integrated heat of each injection (black square) and the fit of data (red line).


