. 2023 Jan 17;12:e82947. doi: 10.7554/eLife.82947

Figure 4. Interplay between Fe2+/Co2+ and Ca2+ in HsFpn.

(a) Ca2+ binding in the presence of 2 mM Co2+. (b) Co2+ binding in the presence of 2 mM Ca2+. (c) Fe2+ transport into proteoliposomes in the presence or absence of Ca2+. The external [Fe2+] is 50 µM. ‘1:1’ indicates symmetrical [Ca2+] at 1.25 mM and “10:1” indicates 1.25 mM Ca2+ inside and 0.125 mM Ca2+ outside. 1 mM sodium ascorbate was included in all samples. All fluorescence traces are subtracted from corresponding blank controls using vesicles with no HsFpn. (d) Comparison of initial rates of Fe2+ transport in (c). One-way ANOVA was used for statistical analysis. (e) Ca2+ (1 mM) uptake by HEK cells expressing HsFpn in the presence (dark yellow) or absence (green) of 80 µM Fe2+ that has been pre-loaded into the cells. Uptake is monitored by jGCaMP7s which is co-expressed in cytosol. Cells transfected with an empty vector (dark and light gray) serve as negative controls. Ca2+ transport at different concentrations of Fe2+ (f) or Co2+ (g). Normalized initial rates of Fpn-specific Ca2+ uptake were used to represent relative Ca2+ transport activities. Data were fitted (black solid line) to an inhibitory dose-response equation to calculate IC50 values.

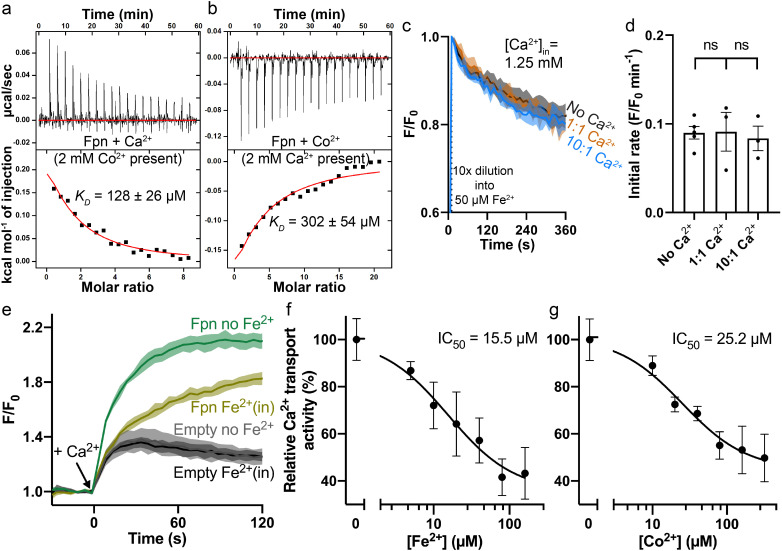
Figure 4.

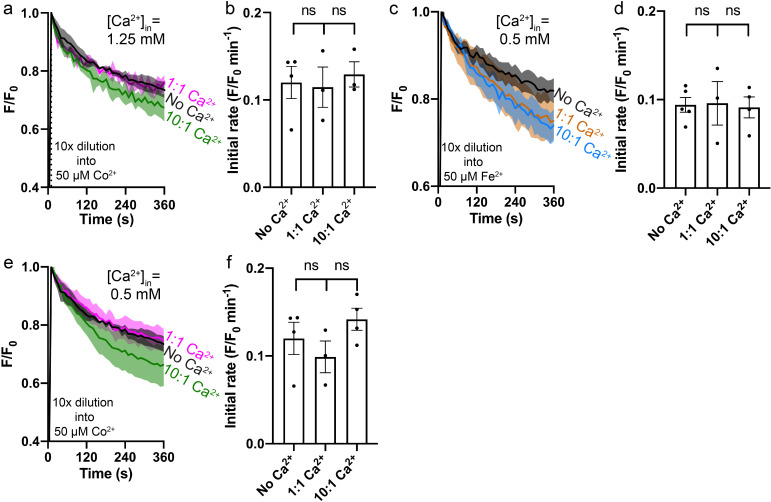
Figure 4—figure supplement 1. Fe2+/Co2+ transport into proteoliposomes by Fpn in the presence or absence of Ca2+.

Figure 4—figure supplement 1.

(a) Co2+ transport with or without 1.25 mM of intra-vesicular Ca2+. (c) Fe2+ transport with or without 0.5 mM of intra-vesicular Ca2+. (e) Co2+ transport with or without 0.5 mM of intra-vesicular Ca2+. (b), (d), and (f) Comparison of initial rates in (a), (c), and (e). Liposome samples were diluted (10×) into outside buffers containing 50 µM Co2+ or Fe2+. ‘1:1’ or ‘10:1’ denotes the ratio of [Ca2+] inside:outside achieved after 10×dilution. 1 mM sodium ascorbate was included in (c). All fluorescence traces were subtracted from their corresponding no protein controls. One-way ANOVA was used for statistical analysis.
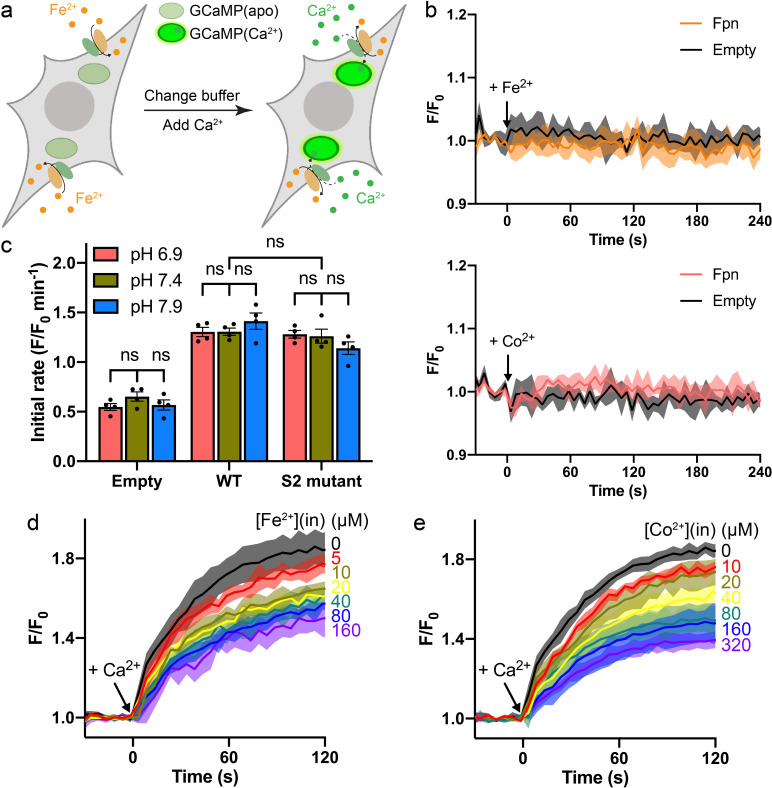
Figure 4—figure supplement 2. Ca2+ transport in the presence of Fe2+ or Co2+ in HEK cells.

Figure 4—figure supplement 2.

(a) Schematic of the Ca2+ transport assay in Fe2+-loaded HEK cells co-expressing Fpn and the Ca2+ sensor jGCaMP7s. (b) Transition metal ions do not interact with jGCaMP7s as indicated by unaltered fluorescence readings during loading of Fe2+ (top) or Co2+ (bottom) into HEK cells expressing Fpn (orange or pink traces) or transfected with empty vectors (gray traces). Black arrows indicate additions of metal ions. (c) Ca2+ transport at different extracellular pHs in the presence of 20 µM Co2+. Two-way ANOVA: among different pHs, p=0.717; among empty, WT, and S2 mutant, p<0.0001; interaction, p=0.130. (d) and (e) Fpn-specific Ca2+ transport in the presence of Fe2+ or Co2+ loaded inside HEK cells. The concentrations of Fe2+ or Co2+ used during the loading step are indicated to the right of each trace. The Fe2+ stock was prepared with a 10-fold molar excess of sodium ascorbate. The raw traces of the empty control group were subtracted from the corresponding traces of the Fpn WT group. Normalized initial rates calculated from the datasets are shown in Figure 4f–g.
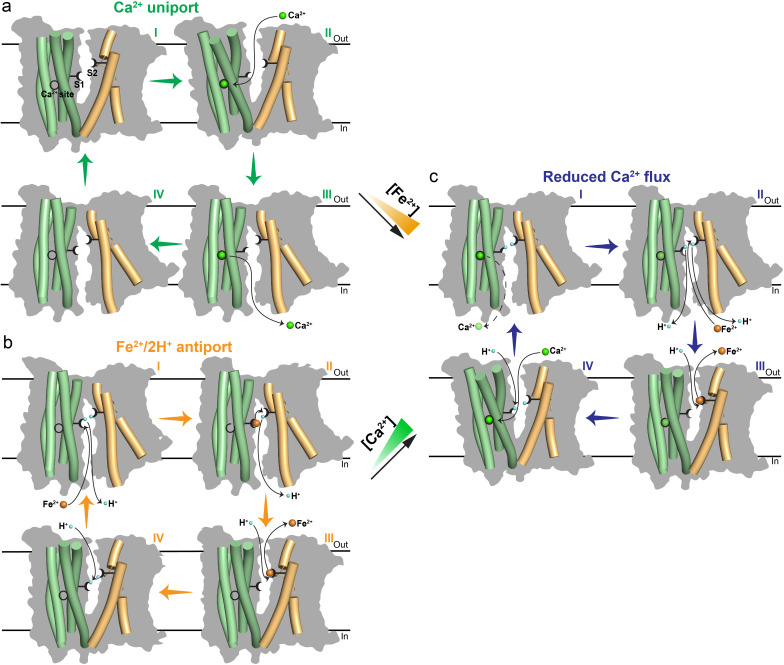
Figure 4—figure supplement 3. Proposed transport mechanisms of metal ions in Fpn.

Figure 4—figure supplement 3.

(a) Electrogenic Ca2+ uniport in the absence of Fe2+. (b) Electroneutral Fe2+/2H+ antiport in the absence of Ca2+. (c) Reduced Ca2+ flux in the presence of Fe2+. Higher concentration of Fe2+ (orange ramp) shows larger inhibition on Ca2+ transport. The inward-facing model is generated based on the bacterial homolog structure (PDB ID 6BTX). The four-helical bundle (pale green) in NTD, and TM7 and TM11 (light orange) in CTD are shown as cylinders and overlaid on silhouettes (grey) of the whole transporter. S1 and S2 of Fe2+ are indicated as black forks with two tines to represent two ligand residues in each site. The Ca2+ binding site is indicated as a black circle. When Fe2+ is bound to S1, the Ca2+ binding site is drawn as an incomplete circle to indicate its partial disruption. Similarly, the S1 becomes a half fork when Ca2+ is bound. H+ (blue), Fe2+ (orange), and Ca2+ (green) are shown as spheres. The black dashed line and shaded green spheres of Ca2+ in (c) indicate reduced Ca2+ release and occupancy.