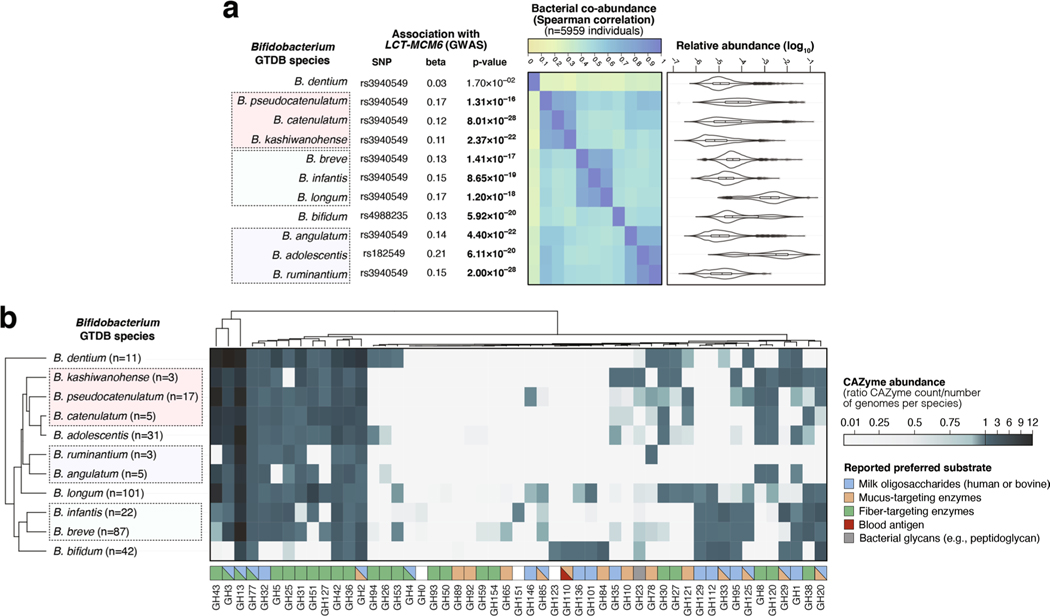
Extended Data Fig. 6 |. Co-abundance and carbohydrate-active enzymes (CAZyme) distribution patterns in 11 Bifidobacterium species harboured by > 25% of individuals in the FR02 cohort.
(a) Associations between the LCT-MCM6 locus and 11 Bifidobacterium species; (left) top association results between variation of 11 Bifidobacterium species and the LCT locus, with study-wide significant associations (with p-values from the joint analysis using GTCA-COJO below the p < 3.8 × 10⁻¹¹ threshold) highlighted in bold; (middle) Two-sided Spearman coefficients calculated on CLR-transformed abundances; (right) relative abundances across the FR02 cohort, ranging from 0 (light green) to 1 (dark blue). (b) CAZyme distribution patterns in 327 previously published reference genomes from 11 Bifidobacterium GTDB species which were included in the GTDB release 89 index used to classify metagenomes in this study. The heatmap indicates abundance of corresponding CAZyme families in species, corresponding to the total count of detected families for each species divided by the number of reference genomes examined for the same species. Values <1 (white to light blue) indicate that less than one copy per genome of the corresponding CAZyme family was detected for each species, values >1 (light blue to dark blue) indicate that more than one copy per genome was detected. Preferred substrate groups are based on literature search and descriptions on CAZypedia.org. For all box plots (A), the central line, box and whiskers represent the median, interquartile range (IQR) and 1.5 times the IQR, respectively. Violin plots represent the distribution density of the data points.

