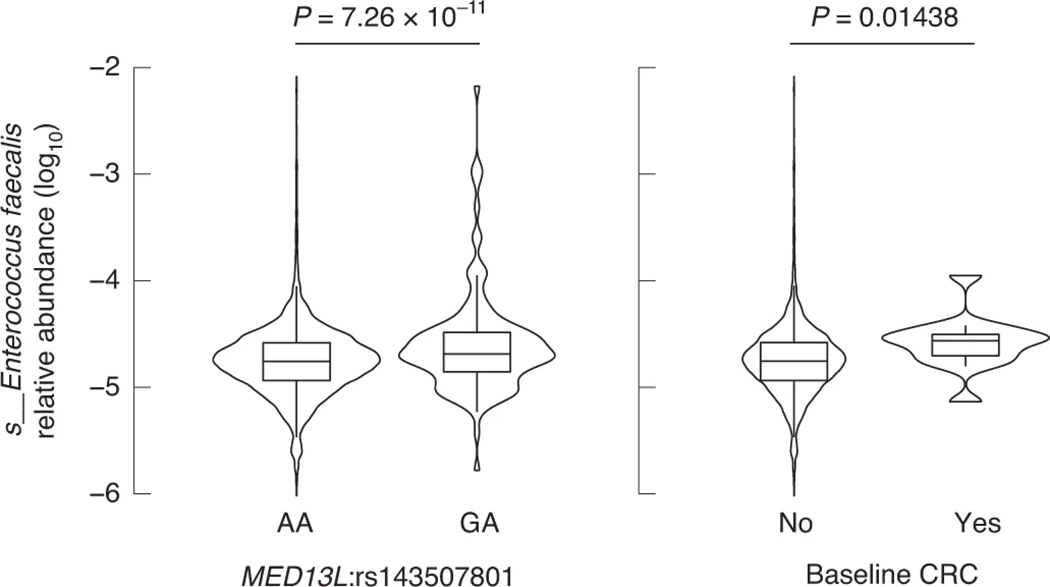
Fig. 5 |. Effect of host genetics and prevalent CRC on gut levels of E. faecalis associated with MED13L variation across participants of the FR02 cohort.
Abundances are compared across individuals grouped according to (left panel) MED13L:rs143507801 genotype and (right panel) CRC prevalence according to the Finnish Cancer Registry. The comparison between E. faecalis variation and MED13L:rs143507801 reflects the GWAS results (Supplementary Table 1). The comparison of E. faecalis abundances in individuals with or without a history of CRC at the time of sampling was performed using a Wilcoxon rank test. Sample sizes for compared groups of individuals: rs143507801:A/A (n = 5,825), G/A (n = 130) (note: only 1 of 5,959 individuals in our cohort was G/G); with CRC (n = 14), without a history of CRC at baseline (n = 5,941). For all box plots, the central line, box and whiskers represent the median, IQR and 1.5 times the IQR, respectively. Violin plots represent the distribution density of the data points.

