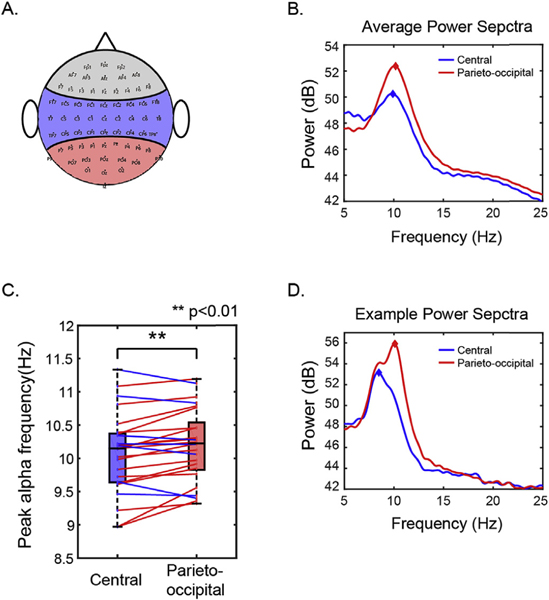
Fig. 3.
Peak alpha power is greater in parieto-occipital electrodes compared to central electrodes. A. Definition of electrode groups. Blue and red area represents the electrodes included in central and parieto-occipital groups. B. Average power spectra of all subjects in central and parieto-occipital electrode groups. C. Comparison of peak alpha frequency in the central and parieto-occipital electrodes. Box plots show group comparisons (as in Fig. 2). Blue and red colored dots plot results from individual subjects; colored lines connect peak frequencies in the two electrode groups for a given subject, with the color of the connecting line shows which peak frequency is greater: blue lines indicate higher peak frequency in central electrodes, while red lines indicate higher peak frequency in parieto-occipital electrodes. D. Example power spectra of one subject with multiple parieto-occipital alpha peaks.

