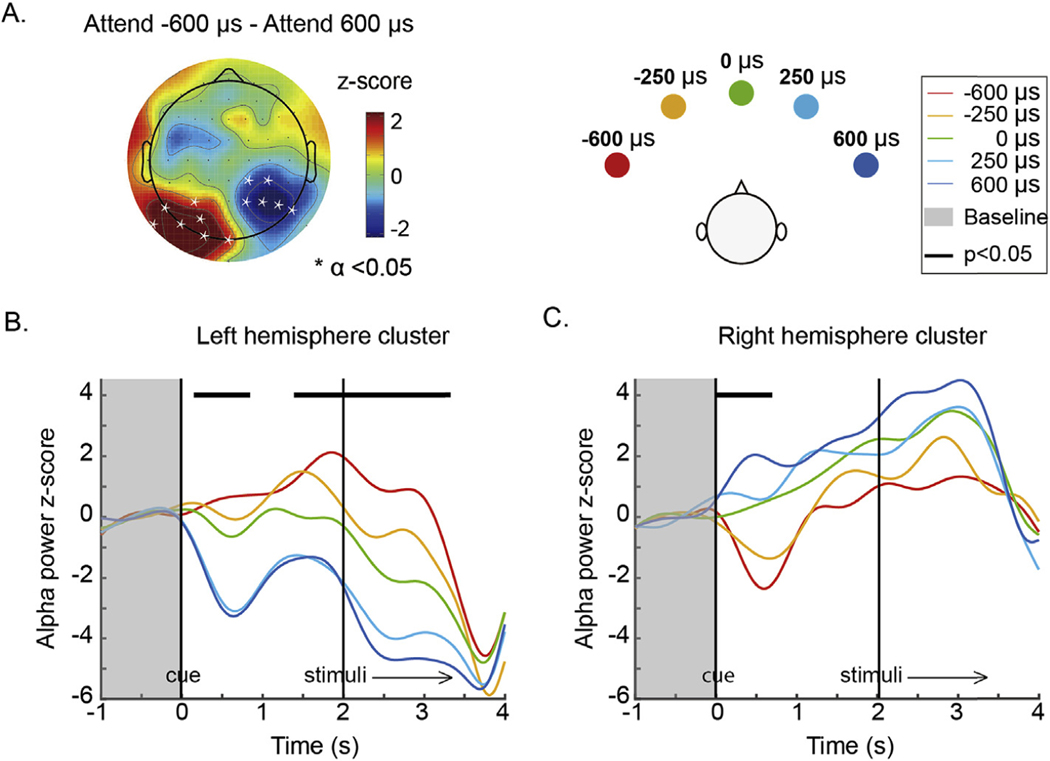
Fig. 4.
A. Topography of alpha power z-score difference between attend far left (target ITD: 600 μs) and attend far right (target ITD: 600 μs) averaged over the whole trial (0–3.4 s). Channels within a cluster in which alpha power changes significantly with direction of attention are marked by asterisks. B & C. Time courses of alpha power dynamics across the trial period for the left parieto-occipital cluster and the right parieto-occipital cluster. Individualized parieto-occipital alpha power was averaged within the left and right clusters shown in A and plotted as a function of time for each target location. Data were divided into 200 ms long time bins and averaged within each time bin. Asterisks at the top of the plot (forming continuous bars, visually) show the time windows in which there was a statistically significant effect of target direction on alpha power after Bonferroni correction. Vertical black lines illustrate the onsets of auditory cue and stimuli. Shadowed areas represent the baseline period.

