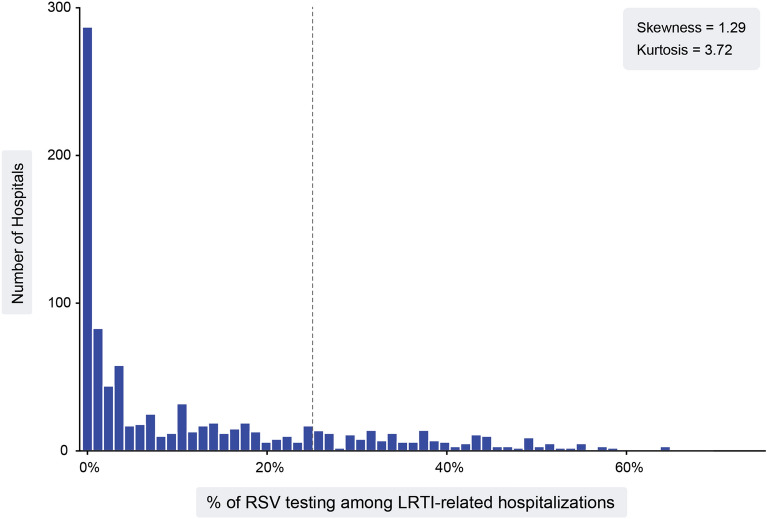
Fig. 1.
Number of hospitals by RSV testing frequency. The number of hospitals (y-axis) associated with their level of RSV testing among LRTI adult (ages 65 +) inpatients, represented as a percentage (x-axis), are shown, with 78.4% of the distribution of hospitals that lie to the left of the dotted vertical line at 25% indicating that 78.4% of hospitals test ≤ 25% of LRTI inpatients for RSV. Skewness is a measure of symmetry, with a value of 0 for normal distributions, while values greater than 1 or less than − 1 indicate a highly skewed distribution. Kurtosis measures the heaviness of the distribution tails, or how many outliers are present in the distribution. Kurtosis values > 1 are considered “peaked” and < − 1 are considered “flat.” LRTI lower respiratory tract infection, RSV respiratory syncytial virus

