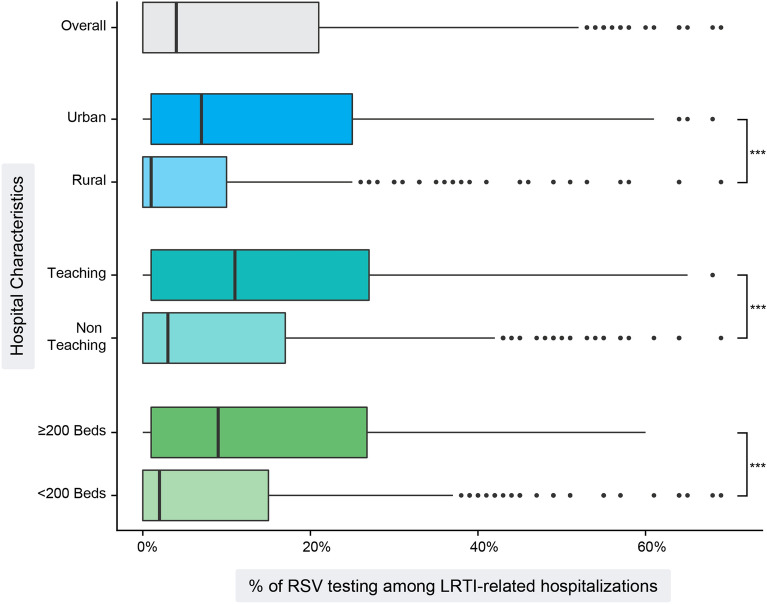
Fig. 2.
Distributions of hospital RSV testing frequencies among LRTI-related hospitalizations by hospital characteristics. Boxplots show distributions, with the IQR (the 25th through the 75th percentiles) represented as the main body of the box, and the median (50th percentile) drawn as a vertical line. The lines extending from the box are the representative ± 1.5 × IQR, and the individual points beyond the lines are potential outliers of the distribution. ***P value < 0.0001. IQR interquartile range, LRTI lower respiratory tract infection, RSV respiratory syncytial virus

