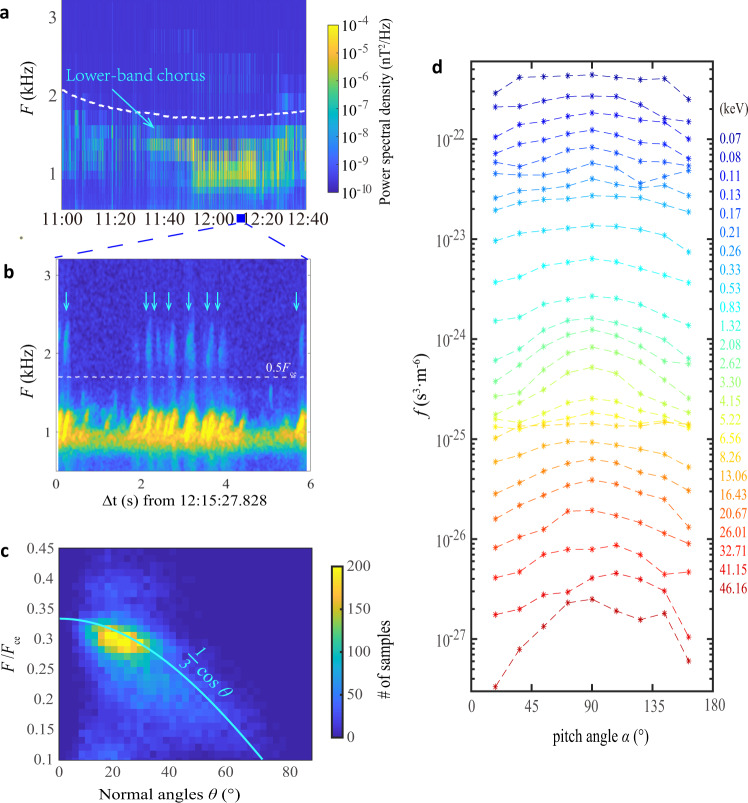
Fig. 1. Van Allen Probe observations of diffuse auroral precipitation event on 14 January 2013.
a, b chorus wave power spectral densities in the survey and burst modes measured by the Van Allen Probe A. The dashed white lines in a and b denote one-half electron gyrofrequencies (Fce), while light blue arrows in b indicate the second-harmonic emissions self-consistently generated by lower-band chorus waves. c Statistical survey of the wave frequency and normal angles of the lower-band chorus waves in second-harmonic events, which is shown to fall around the preferred condition marked by the light blue curve. d Electron space distributions during the time interval shown in b. Pancake distributions, identified as the peaked fluxes around a pitch angle of 90°, are captured, especially in energies during 0.5–4 keV, which is verified to be the result of those observed second-harmonic emissions exhibited in b.

