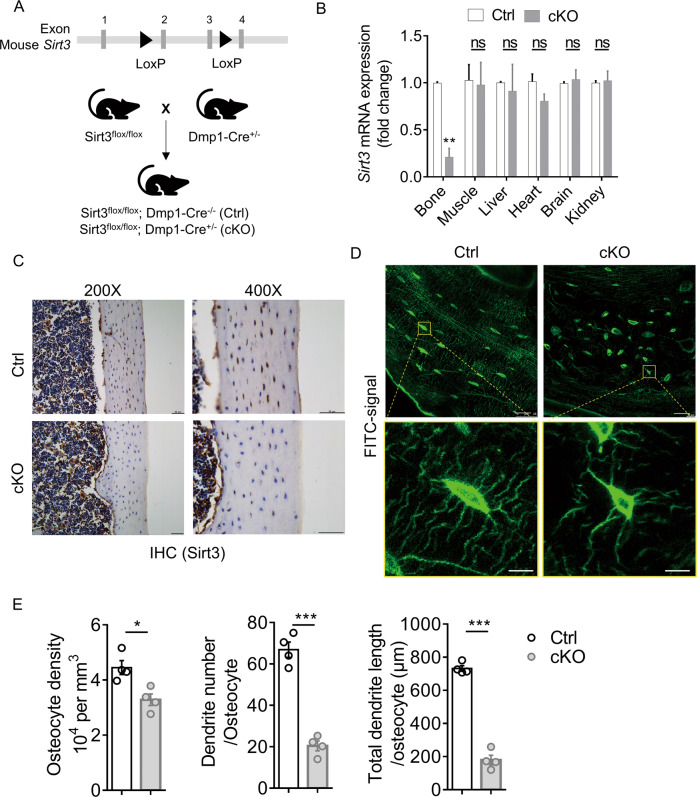
Fig. 3. Deletion of Sirt3 in osteocyte impaired osteocyte dendritic processes.
A Breeding strategy for generation of the osteocyte-specific Sirt3 knockout (cKO) mice and control (Ctrl) mice. B qPCR analysis of Sirt3 expression in different tissues of 3 months male Ctrl and cKO mice (n = 4). C Immunohistochemistry (IHC) of Sirt3 in the cortical bone of 3 months Ctrl and cKO mice. Scale bars = 50 μm. D Representative images of confocal imaging of fluorescein isothiocyanate (FITC)-stained (green) osteocyte in the midshaft femur sections showing osteocyte connectivity in 3 months male Ctrl and cKO mice. Scale bars = 20 μm (upper panel) and 5 μm (lower panel). E Quantification of osteocyte density, dendrite number per osteocyte, and the total dendrite length per osteocyte of 3 months male Ctrl and cKO mice (n = 4). All data were presented in mean ± SEM and analyzed with Student’s t test. *p < 0.05, **p < 0.01 and ***p < 0.001, ns not significant.

