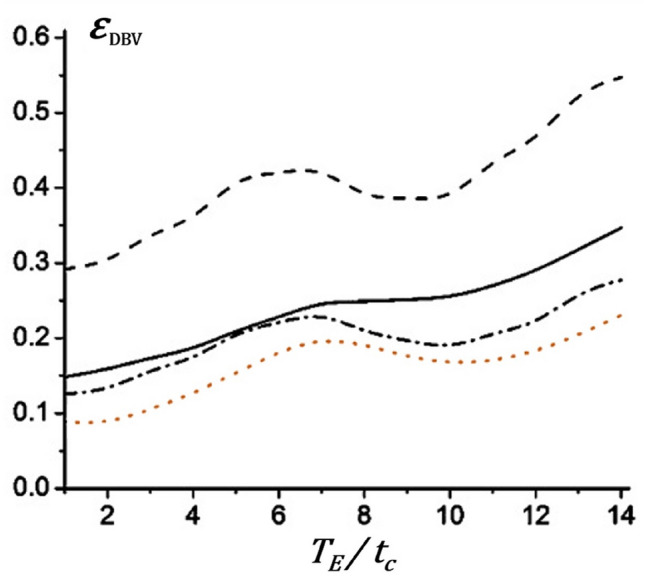
Fig. 1.

The comparison of the relative errors as functions of echo time (TE). Solid lines: one-compartment model; dashed lines: two-compartment model (i) tissue and ISF/CSF; dotted lines: two-compartment model (ii) tissue and blood; dash–dotted lines: three-compartment model (iii) tissue, CSI/CSF, and blood [Adapted from Wang et al. (2013) with permission]
