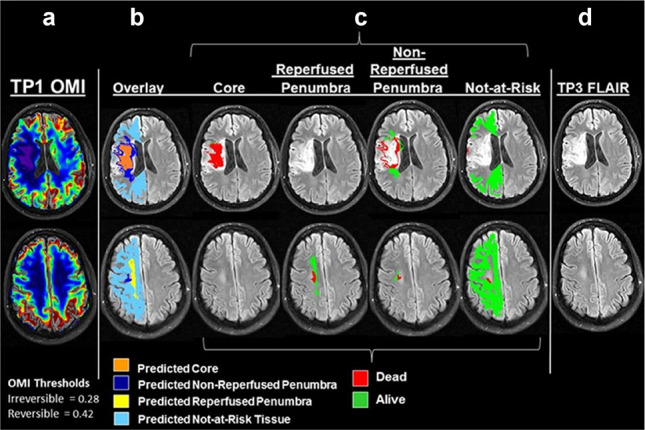
Fig. 7.

An example from a patient with a right middle cerebral artery stroke. The OMI map two hours after onset was in column (a), with an OMI threshold of 0.28 to differentiate infarct core from penumbra, and 0.4 to differentiate the penumbra from tissue not-at-risk. The second MRI scan, six hours after onset, further subdivided the penumbra (b). Survived (green) or died (red) tissues in column (c) were determined by FLAIR imaging after 1 month (d). [Adapted from An et al. (2015) with permission]
