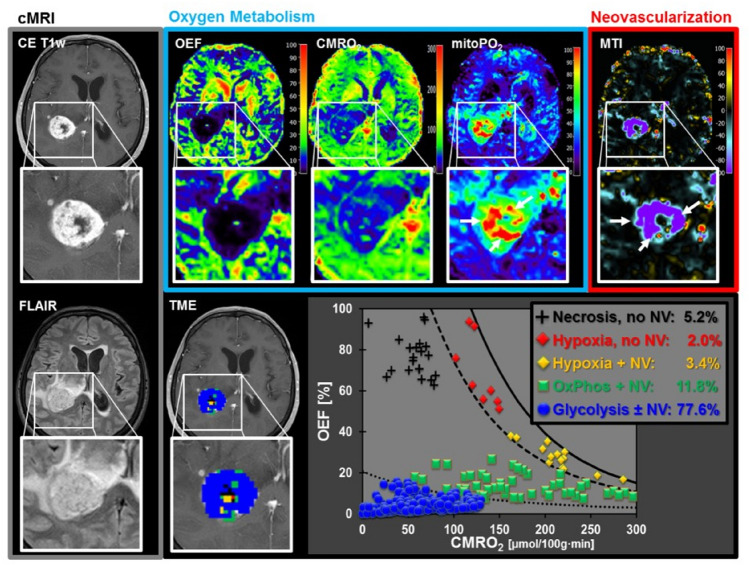
Fig. 9.
A patient with a glioblastoma IDH1 wt showing features of the glycolytic dominated phenotype. The large areas of the lesions with both very high mitochondrial oxygen tension (mitoPO2) and very high micro-vessel type indicator (MTI) values, representing the presence of glycolysis, and proliferation of functional neovascularization, respectively. [Adapted from Stadlbauer et al. (2018) with permission]

