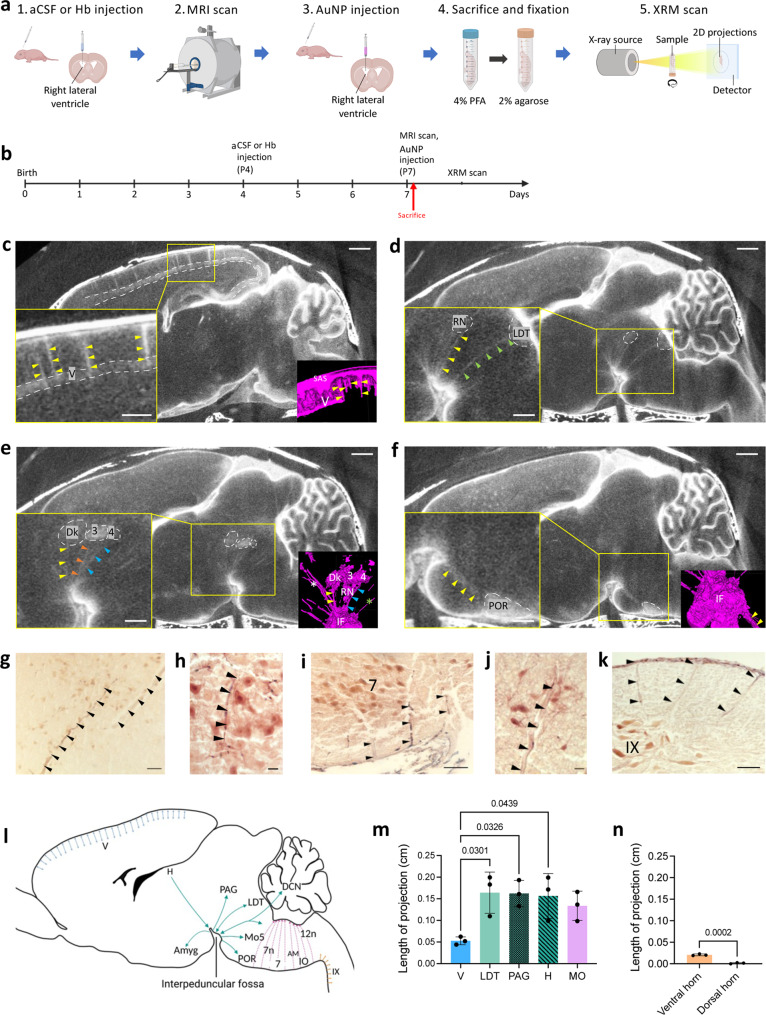
Fig. 1. CSF pathways target intraparenchymal cell populations throughout the forebrain, midbrain, hindbrain, and spinal cord.
Workflow (a) and timeline (b) for 1.9 nm gold nanoparticle enhanced X-ray microtomography (AuNP-XRM). c–f Sagittal XRM demonstrates CSF pathways arising from the subarachnoid space (SAS) to deliver 1.9 nm AuNPs to layer V of the cerebral cortex (yellow arrows, V) (c). There were also prominent basal CSF pathways arising from the interpeduncular fossa (IF) and basal cisterns to deliver AuNPs to the red nucleus (yellow arrows, RN) and laterodorsal tegmentum (green arrows, LDT) (d); the nucleus of Darkschewitsch (yellow arrows, DK), oculomotor nucleus (orange arrows, 3), and trochlear nucleus (blue arrows, 4) (e); and the periolivary region (yellow arrows, POR) (f). Higher magnification insets (bottom left) and 3D segmentations (bottom right) provide alternative visual representations of these CSF pathways. XRM scalebar = 1 mm, inset scalebar = 500 µm. g–k Histology showing CSF pathways into the hypothalamus (g), facial nerve nucleus (h, i), nucleus ambiguus (j), and lamina IX of the spinal cord (k). Black arrowheads indicate AuNP CSF pathways. g Scalebar = 50 µm, h scalebar = 25 µm, i scalebar = 100 µm, j scalebar = 25 µm, k scalebar = 100 µm. l Schematic representation of CSF pathways and a subset of their intraparenchymal targets identified with AuNP-XRM. Abbreviations: V, layer V of the cortex; H, habenula; Amyg, amygdala; PAG, periaqueductal gray (including oculomotor nucleus); LDT, laterodorsal tegmentum; Mo5, motor nucleus of the trigeminal nerve; POR, periolivary nucleus; 7, 7n, facial nucleus; AM, nucleus ambiguus; 12n, hypoglossal nucleus; IO, inferior olivary nucleus; DCN, deep cerebellar nuclei, IX, lamina IX of the spinal cord. m 1.9 nm AuNP influx depth into the brain parenchyma along basal and cortical CSF pathways. Data are mean ± S.D., n = 3 rodents, One-way ANOVA with post-hoc Tukey. Abbreviations: V, layer V of the cortex; LDT, laterodorsal tegmentum; PAG, periaqueductal gray, H, habenula; MO, medulla oblongata. n 1.9 nm AuNP influx depth into the spinal cord parenchyma along ventral and dorsal CSF pathways. Data are mean ± S.D., n = 3 rodents, unpaired two tailed t-test. Source data are provided in Supplementary Information. Figure 1a, l were created with BioRender.com.

