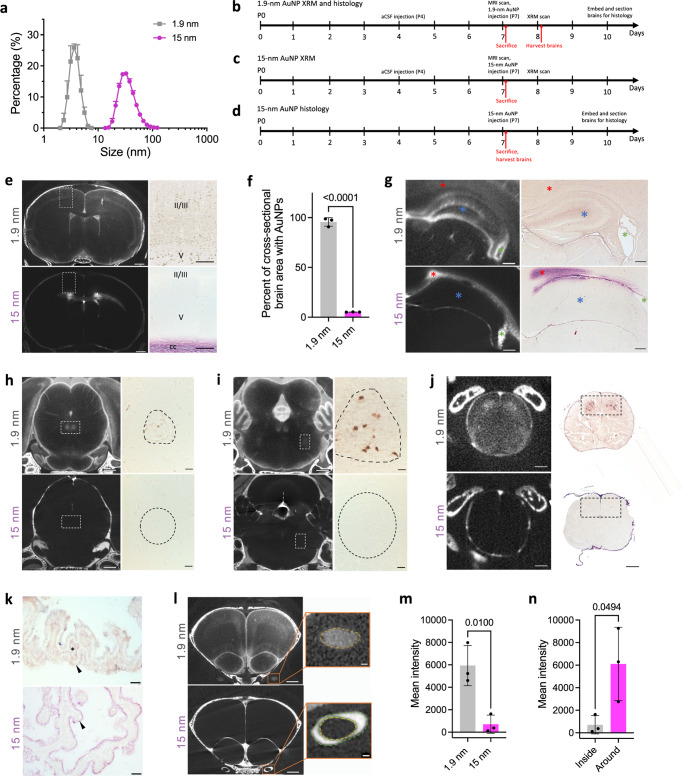
Fig. 4. Size-dependent CSF tracer distribution in the parenchyma, choroid plexus, and optic nerve.
a Hydrodynamic diameters of 1.9 and 15 nm gold nanoparticles (AuNPs) are 3.79 and 35.91 nm, respectively. Data are representative of n = 32 15 nm AuNPs and n = 30 1.9 nm AuNPs. b–d Experimental timelines for 1.9 nm AuNP X-ray microtomography (XRM) and histology (b), 15 nm AuNP-XRM (c), and 15 nm histology (d). 1.9 nm AuNP-XRM followed the same workflow as described in Fig. 1a, b. e XRM and histology of 1.9 and 15 nm AuNP cortical distribution 10 min after intraventricular injection in P7 rodents. 15 nm AuNP distribution was primarily extracellular, while 1.9 nm AuNPs interacted with cells. XRM scalebar = 1 mm, histology scalebar = 100 µm. f 1.9 nm AuNPs cover more cross-sectional brain area than 15 nm AuNPs. Data are mean ± S.D., n = 3 rodents, unpaired two-tailed t-test. g XRM and histology showing 15 nm AuNP movement into the corpus callosum (red asterisk) but not the hippocampus (blue asterisk) 10 min post-injection into the lateral ventricles (LV) (green asterisk). XRM scalebars = 250 µm, histology scalebars = 250 µm. h–j XRM and histology of 1.9 and 15 nm AuNP distribution in the midbrain and oculomotor nucleus (h), pons and trigeminal motor nucleus (i), and spinal cord (j). h, i XRM scalebars = 1 mm, histology scalebars = 50 µm; j XRM scalebars = 250 µm, histology scalebars = 250 µm. k Histology of 1.9 nm (top) and 15 nm (bottom) AuNP distribution in the right LV choroid plexus 10 min after AuNP injection showing apical (15 nm, black arrowhead) vs. apical and basolateral (1.9 nm, black arrowhead and asterisk respectively) choroid plexus coverage. scalebars = 25 µm. l–n XRM of 1.9 nm (top) and 15 nm (bottom) AuNP distribution in and around the optic nerve (l) and mean intensity of 1.9 and 15 nm AuNPs within the optic nerve (m) 10 min after 1.9 nm AuNP injection and 4 h after 15 nm AuNP injection. 15 nm AuNPs were primarily located around (vs. within) the optic nerve (n). l scalebar = 1 mm, inset scalebar = 100 µm. m, n Data are mean ± S.D., n = 3 rodents, unpaired two-tailed t-test. Source data are provided in Supplementary Information.

