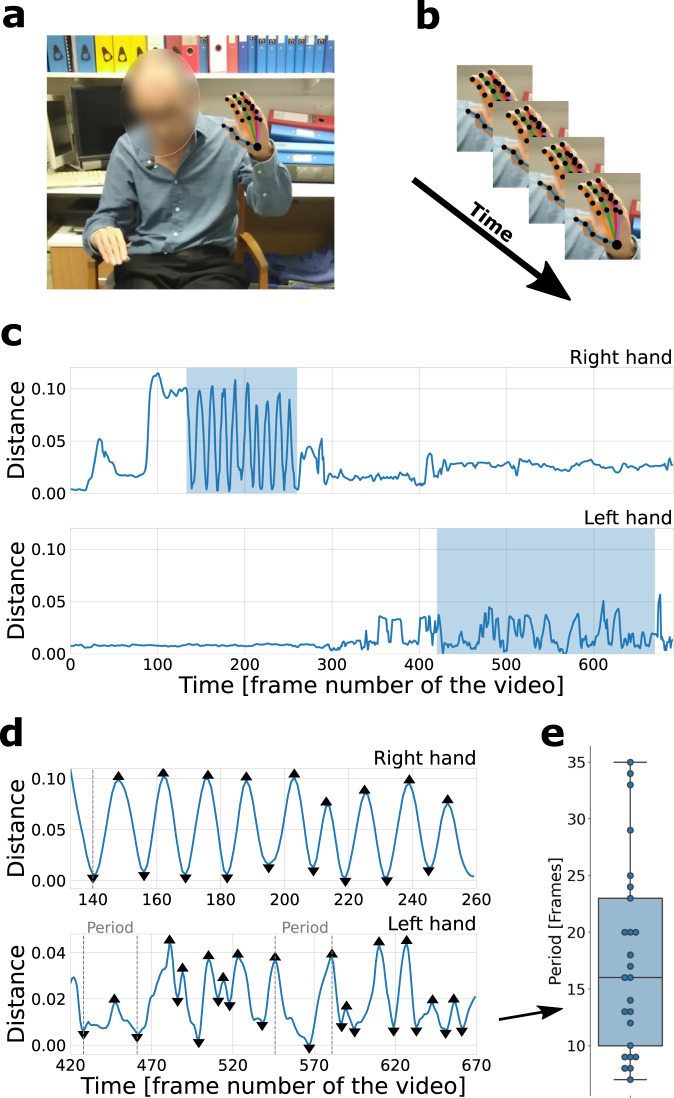
Fig. 6. Feature extraction overview.
a The deep learning library OpenPose44 was used to extract 25 body and 21 hand key points from each frame of the video. The photograph is published with written consent from the patient. b Coordinates of the key points across the frames were used to construct time-series signals. c An example of finger-tapping signals (i.e. Euclidean distance between index finger tip and thumb-tip key points) for right (top) and left (bottom) hand. In this case, the right hand received a low severity score of 1, while the left hand received a high severity score of 4. The highlighted regions depict the regions of interest (ROIs); i.e. when the action was performed. d Detected peaks and troughs on the signals of the two ROIs for the right hand (top) and left hand (bottom). Features were constructed from these signals. The time between peaks corresponds to the time between successive finger taps. e The distribution of periods (in number of frames between consecutive peaks and troughs) is extracted from the lower panel (left-hand signal) of (D). The box ranges from the first quartile (Q1) to the third quartile (Q3) of the distribution, the median is indicated by the center line, the whiskers indicate the distance 1.5*IQR (interquantile range) below Q1 and above Q3. One of the features, range of period between actions, is calculated as maximum minus minimum period.

